Coos Economy Rebounding
[innerindex]In Summer 2013, the Coos economy began to grow again. The Coos Index increased from the prior year for the first time since Winter 2011. Three of five component indicators turned up from summer 2012. The region’s tourism sector continued to be a force behind this recovery; both spending at lodgings and average Saturday traffic counts were up from prior quarter. As a result, the labor market was stronger; the number of employed residents expanded two straight seasons on a year-over-year basis, and wages and salaries grew three consecutive seasons. In addition, the housing market boom provided another boost to the region’s economy.
The State’s economy grew stronger in Summer 2013. The pace of growth in the State Index accelerated for the second quarter in a row. All five component indicators turned up from the prior year. The tourism sector led the way for the state’s economy. More travelers came, and spent more money. The labor market seems to be getting stronger as well; the pace of growth in the number of employed residents accelerated for the second consecutive quarters on a year-over-year basis, and wages and salaries increased four straight quarters. Leading indicators, however, suggested that the state’s economy was not yet on a strong footing. Only two of the four state leading indicators remained up; inverted initial unemployment claims and weekly work hours were up, while building permits of single family homes and new business formation were down. The state’s housing market continued to expand, although there were signs that the boom was nearing its peak.
Student Report by Sean McGlynn
More than ever before, energy production is a pressing factor for all businesses, but especially large, industrial corporations. Businesses are affected not only by the high and fluctuating prices of oil, but also by growing consumer demand for cleaner, eco-friendly businesses. Clean energy production is even more important in the beautiful north country of New Hampshire, a region that prides itself on its natural resources, and attracts many visitors due to its pristine lakes and stunning mountain landscapes. The desire to attract new businesses, while maintaining its natural splendor, has always been a pressing issue in Coös County. The Portland Natural Gas Transmission System offers great potential for both existing and prospective businesses, as a cleaner and more affordable source of energy than oil.
The Portland Natural Gas Transmission System pipes natural gas in from Canada, down through Coös County, and out of the state in Gorham. Natural gas can be used for heating and electric generation, as well as transportation. A modular design step-down station can be used anywhere along the pipeline to tap into the fuel, and prepare it for use. It is much cleaner burning than most traditional fossil fuels, and after a relatively high start up cost, it offers serious cost advantages, especially at commercial and industrial levels. Currently natural gas has been hovering around half the price of oil, and the United States Energy Information Administration projects that this price advantage will grow through 2040.
Although this large source of energy is being piped through Coös, almost all of it is being used south of the county. Jon Freeman, President of Northern Community Investment Corporation (NCIC), notes that “natural gas is a tremendous economic advantage available in the north country, one that has great potential to attract new businesses, and to boost the economy.” An example is the Gorham Paper and Tissue Plant. Gorham Paper and Tissue recently reopened the mill formerly known as Fraser Paper in September of 2012. Gorham Paper and Tissue was able to reopen and be competitive, largely due to the economic advantages of natural gas over oil. Willis Blevins, former Plant Manager of Gorham Paper and Tissue, said at the time of reopening that “there was a big difference when we converted to natural gas – it allowed us to be competitive.” This reopening provided 213 jobs to the region, and the plant now burns cleaner than ever before, using a mix of natural and methane gas to power its machines.
NCIC is “talking to businesses in all phases of consideration” says Freeman, as it hopes to both attract new businesses, and cut costs for existing establishments. One use of the natural gas pipeline, which could be seen in the future, is the establishment of a business park in Coös County. Multiple businesses would share the initial cost of tapping into the pipeline, allowing them access to its financial advantages.
One location where this is a very real possibility is in Groveton. Groveton was formerly home to the Wausau Paper Mill, until its closure in 2008. Wausau was by far the primary employer in and around Groveton, employing over 800 people. The mill is currently being torn down, and is located in a 100 acre site with large industrial size buildings. Benoit Lamontagne, North Country Regional Resource Specialist for the NH Department of Resources and Economic Development, says that natural gas “will play a role in turning that side of Coös county around economically and will make it possible for manufacturers to come up and be competitive”. There is already a step-down station located in Groveton, which is needed to draw natural gas from the pipeline and to reduce the pressure to a usable level. With the industrial site and step-down station already in place “we can without a doubt expect to see natural gas being used in Groveton in the future” says Lamontagne.
“NCIC continues to keep the ball rolling on the natural gas pipeline, until businesses realize the huge advantages the North Country can provide over other regions” says Jon Freeman. Freeman expects that we will see more use of natural gas in the near future. This advantage is right underneath the North Country, literally waiting to be tapped into. The success of Gorham Paper and Tissue will hopefully help shed a light on the advantages of natural gas to prospective businesses as they continue to try and find lower cost, cleaner energy. Natural gas is one of many economic opportunities that lie untapped in the North Country, just waiting for the knowledge and support to get them started.
Coincident Index

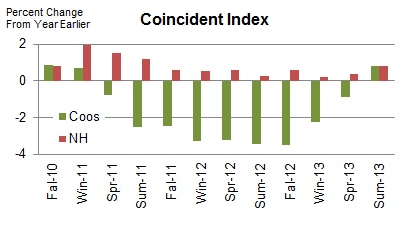
The Coos Coincident Index, which tracks the current state of the Coos economy, rose to 88.2 in Summer 2013 from Spring’s revised value of 87.9. On a quarterly year-over-year basis, the Index increased for the first time since Winter 2011.

The New Hampshire Coincident Index increased to 96.3 in Summer 2013 from Spring’s revised value of 96.0. On a quarterly year-over-year basis, the index increased for the 12th consecutive quarters.
How strong are the forces of change?
In Summer, the Coos Coincident Index rose for the first time since Winter 2011. Three of five component indicators turned up from their Summer 2012 levels. The State Index increased for the 12th quarter in a row on a quarterly year-over-year basis. All five component indicators were up from a year ago. The pace of growth increased two quarters in a row.
Household Employment
Household employment measures the number of employed residents. In contrast to non-farm payroll employment that is more commonly used in the national and state indexes, household employment includes self-employed, unpaid domestic help and both farm and non-farm workers, all of which may be more significant in rural than urban economy. Employment tends to rise as economy grows.
 Coos County
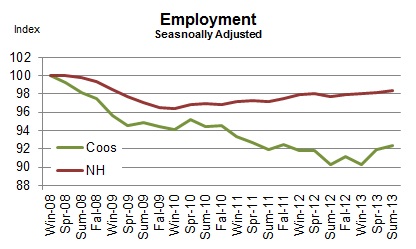
The employment index, adjusted for seasonal variation, increased for the third time in five quarters. On a quarterly year-over-year basis, it expanded two straight quarters after falling nine quarters in a row.
New Hampshire
Employment at the state level, adjusted for seasonal variation, increased for the fourth quarter in a row. On a quarterly year-over-year basis, it continued to expand at a crawling pace.
Rooms Revenue
Rooms revenue represents spending on accommodations paid by travelers. It’s a good hospitality sector’s indicator in the sense that it’s not an estimate, but an official count as reported by the New Hampshire Department of Revenue Administration. However, it may not fully reflect changes in the overall activity level in the hospitality sector. Although it tracks a majority of overnight travelers, it excludes day travelers and overnight travelers staying with friends and family and those who have second homes. In the case of the northern regions of the state, the effect of the drawback is less of a concern since day travelers are a small minority due to the distance from the major urban areas.
Coos County

The estimated rooms and meals revenue, adjusted for inflation and smoothed by the four quarter moving average, increased for the third quarter in a row. On a quarterly year-over-year basis, it increased two straight quarters.
New Hampshire
The estimated rooms and meals revenue, adjusted for inflation and smoothed by the four quarter moving average, increased for the second consecutive quarter. On a quarterly year-over-year basis, it rose two straight quarters.
Traffic Counts
It tracks the average vehicle traffic counts on Saturdays each quarter, which is automatically collected from traffic recorders located throughout the State. 12 recorders are selected to reflect traveler traffic in each of the seven travel regions in the State with two recorders from Coos County – Jefferson and Northumberland.
 Coos County
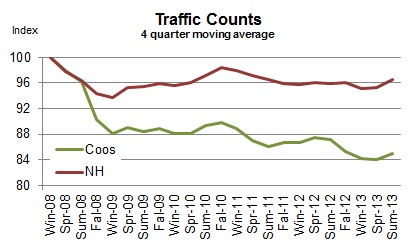
Average Saturday traffic counts, smoothed by the four quarter moving average, bounced back after decreasing fourth consecutive quarters. Still, it declined four straight quarters on a quarterly year-over-year basis.
New Hampshire
Average Saturday traffic counts, smoothed by the four quarter moving average, increased for the third time in four quarters. On a quarterly year-over-year basis, it turned up for the second time in four quarters.
Wages and Salaries
The estimated wage and salaries disbursements represent total compensation including pay for vacation, bonuses, stock options, and tips. This data is obtained from all workers covered under state and federal unemployment insurance laws; in other words, it is full population counts, not sample-based estimates. Unlike the household employment report, however, it excludes self-employed, domestic workers, and most agricultural workers. For this difference, wages and salaries series complements the number of employed residents in monitoring the labor market conditions as well as the economy. A change in wages and salaries, adjusted for inflation, may reflect changes in the number of jobs, the ratio between part-time and full-time jobs, and wage rates.
Coos County

The estimated wages and salary disbursement, adjusted for inflation and smoothed by the four quarter moving average, inched down for the second quarters in a row. On a quarterly year-over-year basis, though, it expanded three straight quarters.
New Hampshire
The estimated wages and salary disbursement, adjusted for inflation and smoothed by the four quarter moving average, decreased for the second quarter in a row. On a quarterly year-over-year basis, though, it increased for the fourth consecutive quarters.
Industrial Electricity Sales
It measures sales of electricity (kWh) to industrial customers. Utilities categorize consumers based on the North American Industry Classification System, demand, or usages. The industrial sector includes manufacturing, construction, mining, agriculture, fishing, and forestry establishments. Among these industries, manufacturing is a primary industry in Coos County making up 69% (73% for New Hampshire in 2008) of the total number of jobs in the industrial sector mentioned above according to the 2006 QCEW data. Therefore, a rise in industrial electricity sales may largely indicate invigorating manufacturing activities in the economy.
 Coos County

Industrial electricity sales, smoothed by four quarter moving average, fell for the 10th consecutive quarter. On a quarterly year-over-year basis, it fell for the ninth consecutive quarter.
New Hampshire
Industrial electricity sales, smoothed by the four quarter moving average, nearly unchanged. On a quarterly year-over-year basis, though, it expanded six quarters in a row.
Real Estate
NCEI reports two real estate market indicators – home sales and median home prices. The data tracks residential homes sold, including condos and manufactured homes. The health of the real estate sector is important to the broad economy due to its multiplier effect. Home transactions not only generate income for real estate brokers and mortgage bankers but also bring more businesses in other sectors including moving services, home furnishings and appliances. In order to minimize volatility in Coos real estate market, indicators are averaged over a four quarter period.
Coos County

In Summer 2013, there were signs that the housing market boom in the County might be nearing its peak. Although both home sales and prices continued to grow, the pace of growth in home sales declined two straight months and the pace of growth in median home prices was down to a single digit from 23.6% in Spring 2012 when it marked the fastest growth since the housing market recovery began.
 New Hampshire
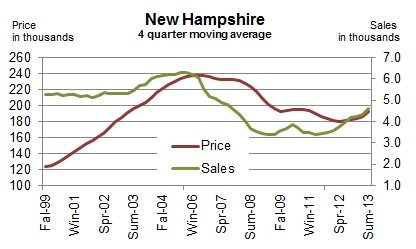
The state’s housing market also showed early signs of slowing. The pace of growth in home sales, smoothed by the four-quarter moving average, decreased to 16.3% from 19.1% in Fall 2012 when it recorded the fastest growth since the state’s housing market recovery began. The median home price, smoothed by four quarter moving average, increased at a faster clip three quarters in a row. However, home prices may also follow the recent trends in home sales, as they tend to lag home sales.
Leading Indicators
Leading indicators are to provide a sense of future economic conditions in the state of New Hampshire. The report includes 7 leading indicators grouped into three different categories – 1) four leading indicators for the broad economy of New Hampshire; 2) two leading indicators of the state’s hospitality industry; 3) a leading indicator of the U.S. economy. The list of leading indicators for New Hampshire’s economy includes initial unemployment claims, average weekly hours of work in the total private sector, building permits, and new business formation; the list for the state’s hospitality industry has gas price, and Canadian dollar; the report also includes interest rate spread between 10-year Treasury and federal funds for the U.S. economy. Although the list is by no means exhaustive and indicators often do not go back long enough in time for statistically robust analysis, we believe it can still be a helpful tool. Raw data are processed so as to make it easier to detect a change in the direction of the underlying trend in the economy. In the summary table below, “up” during recession indicates recovery around the corner while “down” during an expansion signals an impending recession. During expansion, the likelihood of recession increases when more indicators turn down persistently. For example, all four leading indicators of NH economy start posting “down” month after month at the beginning of the state’s 2008 recession. The New Hampshire recessions are defined as the period of declines in the New Hampshire Coincident Index published by the Philadelphia Federal Reserve Bank.
In August 2013, two of the four leading indicators for New Hampshire were up compared to six months ago in their year-over-year growth rate.
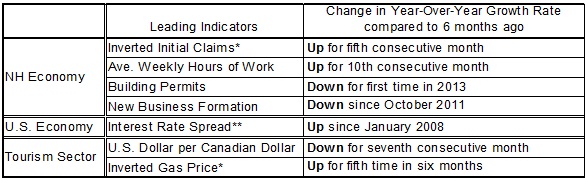
*These series are inverted so that an “up” means an improvement. Layoff decreases (inverted layoff increases) when the labor market conditions improve; and a decrease in gas prices (an increase in inverted gas prices) may help increase the number of travelers. **”Up” or “down” in this series is a change from prior month as opposed to from 6 months ago.
 Initial Unemployment Claims

The series is inverted so that an increase means an improvement. Initial claims decrease (inverted initial claims increase) when the labor market condition improves. The number of Initial claims tends to lead the business cycle. The chart demonstrates that it correctly predicted both the beginning and the ending of the past two recessions.
Average Weekly Hours of Work in Private Sector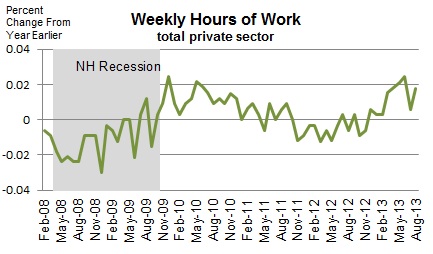
It tends to turn before the economy does because employers often increase work hours of existing workers at the beginning of the recovery before committing to new hires; they do not want to take the risk of committing to new hires and seeing the economy fall back again. This data for New Hampshire only goes back to 2007.
 New Business Formation

All companies that want to do business in the state must register at the NH Secretary of State. This data includes all types of businesses including corporations and limited liabilities companies. The number of new businesses tends to lead the business cycle. Although this series goes back only to 2006, it correctly predicted the beginning and ending of the state’s 2008 recession. The series is smoothed by 12 month moving average.
Building Permits for Single Family Homes
It’s often the case housing recovery leads the broad economy out of recession. This is because of its extensive ripple effect over the rest of the economy. Building construction requires inputs from many other industries such as window manufacturing, logging, plumbing, electricity services, banking, and home furnishings such as consumer electronics and furniture. The 2001 recession was a mild recession and a rare one that did not involve a housing slump. The series is smoothed by four month moving average.
 Interest Rate Spread
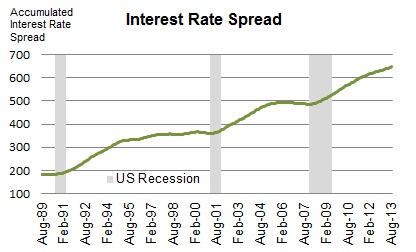
The interest rate spread, the 10 year Treasury less the Federal Funds, is considered one of the best leading indicators for the national economy. The indicator is the sum of all the past values plus the spread in the current period. Therefore, it decreases when the current spread is negative (the 10 year T rate is lower than the Fed Funds Rate), which is indicative of an impending recession.
Canadian Dollar

The value of Canadian dollar (the U.S. dollar per Canadian dollar) is an important indicator of the current and future tourism activity in the State of New Hampshire. Canada is the most important source of foreign travelers in the state. An increase in the value of Canadian dollar makes travel to the U.S. more affordable for Canadians. The chart on the right shows its recent relationship with spending on accommodations by travelers.
 Gas Price

It’s the monthly average of weekly New England regular conventional retail gas prices. A significant decrease in gas prices makes traveling more affordable and can help increase the number of travelers to the state. When gas prices increase substantially, traffic counts tend to fall and vice versa. Gas prices are inverted so that an increase indicates improving conditions.
Technical Notes
- Employment is the number of people employed from the household survey.
- The current values of rooms and meals revenues are estimated using the data obtained from participating local hoteliers.
- The data series reported in the dollar values are adjusted for inflation.
- Real Estate data is obtained from the Northern New England Real Estate Network (NNEREN). All analysis and commentary related to the statistics is that of the authors, and not that of NNEREN.
© Copyright 2010: Daniel Lee and Vedran Lelas, College of Business Administration, Plymouth State University.