Hospitality, the Lone Bright Spot
[innerindex] In August, the economic picture changed little for Coos County. Coos Index fell for the third month in a row on a monthly year-over-year basis. Three out of four available component indicators fell on a monthly year-over-year basis. The hospitality sector remained as the only bright spot; estimated rooms and meals revenue remained up from the prior year. However, the storyline remained little changed for the rest of the economy. The labor market continued to struggle; both indicators – the number of employed residents and estimated wages and salaries – were down from prior year. The manufacturing activity remained sluggish; industrial electricity sales dropped three straight months on a monthly year-over-year basis. August data for average Saturday traffic counts has yet to be released by the New Hampshire Department of Transportation. So the Indexes were constructed assuming no change from July in the variable.The State economy fared better in August than in recent months. The pace of increases in the State Index stopped declining after falling four months in a row. The rebounding hospitality sector offset the slowing the manufacturing activity. The hospitality sector exhibited a strong comeback; estimated rooms and meals revenues grew at increasingly faster rates on a monthly year-over-year basis since May when its growth nearly came to a halt. The picture in the labor market was mixed; the monthly year-over-year growth of employed residents slowed to a crawl, while that of estimated wages and salaries remained strong. These two indicators track different segments of the labor market. The latter represents total compensation paid by the employers that are covered under the federal and state unemployment insurance laws. Changes in wages are due largely to fluctuations in employment. However, the data excludes the self-employed, domestic help, proprietors, all of which are tracked by the number of employed residents. The conflicting reports, therefore, may reflect struggles in many small businesses rather than larger firms.
The real estate market analysis can be found at the end of this report.
Coincident Index

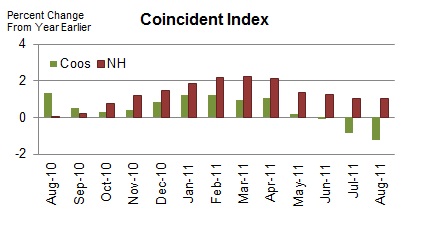
The Coos Coincident Index, which tracks the current state of the Coos economy, inched down to 91.7 from July’s revised value of 91.8. On a monthly year-over-year basis, the Index declined for the third month in a row. 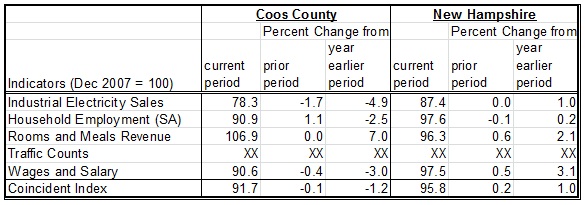
The New Hampshire Coincident Index ticked up to 95.8 in August from July’s revised value of 95.7. On a monthly year-over-year basis, the Index increased at a pace equal to that of prior month.
How strong are the forces of change?
In August, the Coos Coincident Index fell for the third month in a row on a monthly year-over-year basis. Three out of the four available component indicators were down from their August 2010 levels. The State Index increased 12 months in a row on a monthly year-over-year basis. All four available component indicators remained up from prior year. Its monthly year-over-year growth rate changed little from prior month.
Household Employment
Household employment measures the number of employed residents. In contrast to non-farm payroll employment that is more commonly used in the national and state indexes, household employment includes self-employed, unpaid domestic help and both farm and non-farm workers, all of which may be more significant in rural than urban economy. Employment tends to rise as economy grows.
 Coos County

Employment index, adjusted for seasonal variation, expanded two months in a row after falling four straight months. Still, it remained down from prior year.
New Hampshire
Employment at the state level, adjusted for seasonal variation, contracted for the fourth straight month. Still, it remained up from the level seen a year earlier.
Rooms and Meals Revenues
It is estimated from total tax yielded from rooms and meals sales. It tends to increase with tourism activities.
Coos County
The estimated rooms and meals revenue, adjusted for inflation and smoothed by 12 month moving average, changed little from prior month. Still, it remained up from its August 2010 level.
New Hampshire
The estimated rooms and meals revenue, adjusted for inflation and smoothed by 12 month moving average, rose three straight months. And it remained up from prior year.
Traffic Counts
It tracks the average vehicle traffic counts on Saturdays each month, which is automatically collected from traffic recorders located throughout the State. Two recorders are placed in the Coos county – Jefferson and Northumberland.
The August data has yet to be released by the NH Department of Transportation.
Wages and Salaries
The estimated wage and salaries disbursements represent total compensation including pay for vacation, bonuses, stock options, and tips. This data is obtained from all workers covered under state and federal unemployment insurance laws; in other words, it is full population counts, not sample-based estimates. Unlike the household employment report, however, it excludes self-employed, domestic workers, and most agricultural workers. For this difference, wages and salaries series complements the number of employed residents in monitoring the labor market conditions as well as the economy. A change in wages and salaries, adjusted for inflation, may reflect changes in the number of jobs, the ratio between part-time and full-time jobs, and wage rates.
Coos County

The estimated wages and salary disbursement, adjusted for inflation and smoothed by 12 month moving average, dropped from prior month. And, it remained down from a year earlier.
New Hampshire
The estimated wages and salary disbursement, adjusted for inflation and smoothed by 12 month moving average, increased from July. And, it was up from where it stood a year ago.
Industrial Electricity Sales
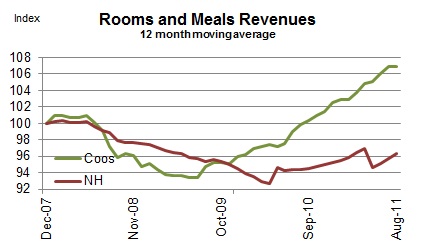
It measures sales of electricity (kWh) to industrial customers. Utilities categorize consumers based on the North American Industry Classification System, demand, or usages. The industrial sector includes manufacturing, construction, mining, agriculture, fishing, and forestry establishments. Among these industries, manufacturing is a primary industry in Coos County making up 69% (73% for New Hampshire in 2008) of the total number of jobs in the industrial sector mentioned above according to the 2006 QCEW data. Therefore, a rise in industrial electricity sales may largely indicate invigorating manufacturing activities in the economy.
 Coos County
Industrial electricity sales, smoothed by 12 month moving average, fell for the fifth consecutive month. On a monthly year-over-year basis, it retreated for the third consecutive month.
New Hampshire
Industrial electricity sales, smoothed by 12 month moving average, changed little from prior month. Still, it remained up from where it was a year ago.
Real Estate
NCEI reports two real estate market indicators – home sales and median home prices. The data tracks residential homes sold, including condos and manufactured homes. The health of the real estate sector is important to the broad economy due to its multiplier effect. Home transactions not only generate income for real estate brokers and mortgage bankers but also bring more businesses in other sectors including moving services, home furnishings and appliances. In order to minimize volatility in Coos real estate market, indicators are averaged over a 12 month period.
Coos County

In August, encouraging signs continued in the Coos real estate market. Home sales, smoothed by 12-month moving average, rose two months in a row on a month-to-month basis. As a result, its year-over-year decline slowed three straight months. These improvements in sale volumes appeared to have put break on falling home prices. Median home prices, smoothed by 12-month moving average, continued to fall, but its year-over-year pace of declines slowed in the past two months. Although it is too early to tell, it might be an early indication that the bottom is near.
 New Hampshire

Free falling prices and historically low interest rates drew more buyers into the state’s real estate market. Home sales, smoothed by 12-month moving average, increased for the second month in a row. Although it remained down from the level seen a year earlier, the year-over-year pace of decline in sales slowed two straight months. Median home prices, smoothed by 12-month moving average, continued to slide at a faster pace.
Leading Indicators
This section is under construction. The future reports will include building permits, initial unemployment claims, new business formation, real estate indicators and possibly freight volumes.
Technical Notes
- Employment is the number of people employed from the household survey.
- The current values of rooms and meals revenues are estimated using the data obtained from participating local hoteliers.
- The quarterly wages and salary disbursements are smoothed into the monthly series after the current values are estimated.
- These models to estimate the current values of rooms and meals revenues and wages and salary disbursements are re estimated once a year in February using updated data.
- The data series reported in the dollar values are adjusted for inflation.
- Seasonal factors for the number of employed residents are recalculated once a year in February using updated data. Thus, the seasonally adjusted data series are to be revised accordingly.
- Real Estate data is obtained from the Northern New England Real Estate Network (NNEREN). All analysis and commentary related to the statistics is that of the authors, and not that of NNEREN.
© Copyright 2010: Daniel Lee and Vedran Lelas, College of Business Administration, Plymouth State University.