The NCEI methodology largely follows the way the Conference Board’s Coincident Index is constructed:
- Following the Conference Board’s Coincident Index, the NCEI collects local economic indicators to track four broad economic processes such as sales, production, employment and income. Refer to Table 1 for comparison.
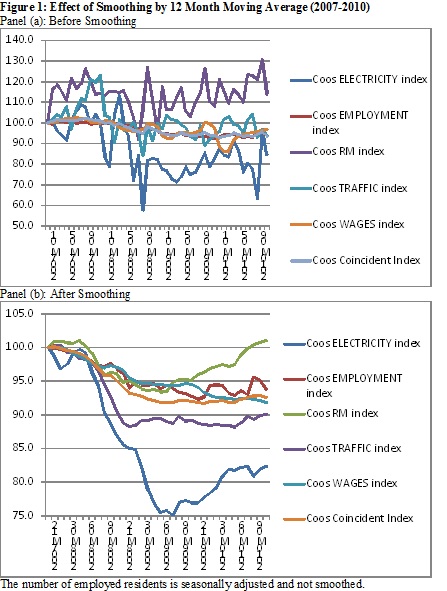
- The NCEI is a quarterly publication and, to reduce volatility, takes a four-quarter moving average of all component indicators before aggregation, except for the least volatile employment indicator. Refer to Figure 1 to see the effect of smoothing.
- All components are aggregated into a single summary index. The weight is given based on the inverse of standard deviation for each indicator. As a result, less volatile variables are given more weight.
NCEI is evaluated in two ways:
- The NCEI State Index was compared to the Philadelphia Federal Reserve’s New Hampshire Index. Refer to Figure 2. Although the NCEI state Index appears to be more volatile, it does approximate the state business cycle measured by the Fed’s Index.
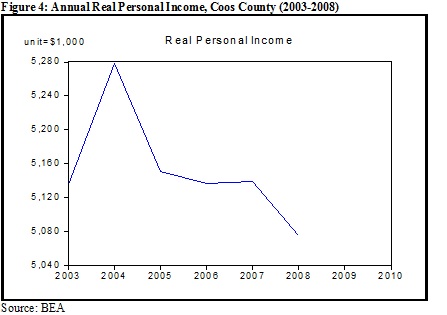
- The NCEI Coos Index is compared against the county’s personal income. Refer to Figure 3. NCEI reveals a downturn in 2004-2006 as well as the Great Recession in 2008-2009. Between the two recessions, the county experienced a short-lived expansion in 2007. This is, by and large, confirmed by real personal income data from the Bureau of Economic Analysis in Figure 4. The county’s annual personal income shows the similar pattern. It declined throughout 2004-2006 before a meager increase in 2007. Then, it took a steep fall in 2008.