Aside from the BALSAMS, Summer 2012 provided a glimpse of hope.
[innerindex]
We are glad to come back to you with a new-look NCEI with improved coverage of the region’s economy. This new issue has three changes; 1) a student–created report has been added to complement the data-driven report and to provide a more comprehensive view of the county’s economy; 2) a new section of leading indicators has been added for New Hampshire to provide a sense of future economic conditions; and 3) the report will now be published quarterly. Ryan Bernier, a Plymouth State senior majoring in Sociology, spent the summer in Coos County, attending events, observing the local economy in action, and interviewing community and business leaders. He’ll be sharing his experiences here and in future issues of the NCEI. We appreciate all of you making your valuable time available and sharing your experience with Ryan.
In Summer 2012, the Coos economy showed signs of encouragement. Although the Coos Index fell for the 6th consecutive quarter on a quarterly year-over-year basis, much of the decline had to do with the temporary closure of the BALSAMS. This weighed on the local economy, particularly in the Colebrook area. Aside from the BALSAMS, however, there are signs of improvement. The labor market improved; both the number of employed residents and their estimated wages and salaries were up from a year ago. Average Saturday traffic counts in Jefferson and Northumberland were up from the prior year, indicative of an increase in travelers to the region.
In Summer 2012, the State Index fell for the first time since the end of the past recession on a quarterly year-over-year basis. Particularly worrisome was the labor market; both the number of employed residents and estimated wages and salaries were down from Spring. The hospitality industry struggled as well; both estimated rooms and meals receipts and average Saturday traffic counts were down from a year ago. The manufacturing industry chugged along; industrial electricity sales inched up from a year ago. Meanwhile, the state-level leading indicators suggest a mixed view of future economic conditions.
Student Report
With much hard work and generous support from many local interests, biomass has the potential to become an important pillar of economic development in the North Country. In Berlin, New Hampshire, biomass is being used for home and commercial heating and as a source of 75 megawatts of electricity. The Burgess Biomass Power Plant has been under construction since late 2011 and is expected to be complete by late 2013. As locals are aware, the site of this construction is the historic paper mill that provided quality jobs to Coös County for more than a century.
The Burgess Biomass Project will have some impact on the economy in the temporary, short-run construction phase as well as in the long-run operational phase. In the current phase, the construction plan requires the services of 400 workers to implement the new boilers and to prepare the facility for operation. Several of these workers are staying at local motels and thus spending their money in the communities of Berlin and Gorham. According to Randy Labnon, co-owner of the Town & Country Motor Inn in Gorham, approximately 25 long-term construction workers are staying at the Inn. Besides supporting the inn, these workers create an indirect effect on the economy through their spending on everyday items such as food, fuel, and recreation.
According to Cate Street Capital, once the construction period ends and the plant is operational approximately forty “direct” jobs will be added to carry out the day to day operations at the facility. The contract between Cate Street Capital and Public Service of New Hampshire requires that 750,000 tons of wood based biomass be utilized each year. Because of this large amount, says Alexandra Ritchie of Cate Street Capital, “approximately 100 truckloads of wood would need to enter the facility on a daily basis, meaning that each direct job could translate into as many as five to seven indirect jobs.” These indirect jobs would be primarily in the logging and trucking industries but would also have the potential to create additional future jobs in local restaurants and grocery stores.
Biomass can also benefit the economy in smaller ways. In addition to large projects such as the Burgess Power Plant, individual boilers that generate heat from wood pellets have emerged onto the market as a viable alternative to oil-based furnaces. Many of these boilers have been subsidized from public and privates sources, and as a result several residential and commercial properties have decided to have the boilers installed. Saint Kieran’s Center for the Arts is one example of a commercial property that has chosen the wood pellet heater. Through this and other “green” upgrades, Saint Kieran’s hopes to cut their energy costs in half. Joe Short, Program & Policy Director for the Northern Forest Center said, “when oil replaces wood we keep 100% of the energy dollar in the local economy. That same dollar circulates for added local benefit.”
The history and culture of Coos County and the North County is closely tied to its natural resources. Therefore, many residents of places like Berlin, “the city that trees built,” are excited to see the area once again turning to the northern forest to spur the local economy.
Coincident Index
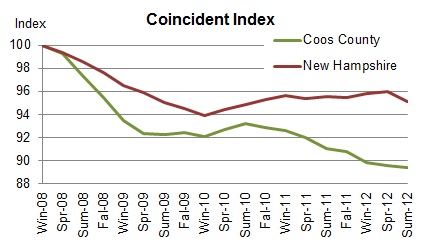

The Coos Coincident Index, which tracks the current state of the Coos economy, fell to 89.4 in Summer 2012 from Spring’s revised value of 89.6. On a quarterly year-over-year basis, the Index declined for the 6th quarter in a row.

The New Hampshire Coincident Index fell to 95.1 in Summer 2012 from Spring’s revised value of 96.0. On a quarterly year-over-year basis, the index was down from a year ago for the first time since Summer 2010.
How strong are the forces of change?
In Summer, the Coos Coincident Index fell for the 6th quarter in a row on a quarterly year-over-year basis. But, the pace of decline slowed for the second consecutive quarter. In addition, three of the five component indicators turned up from their Summer 2011 levels. The State Index decreased for the first time since Summer 2010 on a quarterly year-over-year basis. Three of the five component indicators turned down from prior year.
Household Employment
Household employment measures the number of employed residents. In contrast to non-farm payroll employment that is more commonly used in the national and state indexes, household employment includes self-employed, unpaid domestic help and both farm and non-farm workers, all of which may be more significant in rural than urban economy. Employment tends to rise as economy grows.
 Coos County
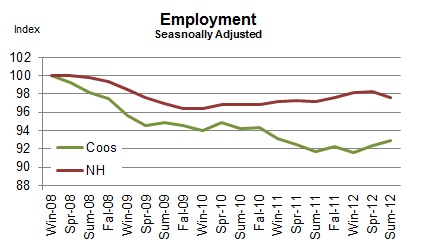
Employment index, adjusted for seasonal variation, expanded for the third time in four quarters. On a quarterly year-over-year basis, it increased for the first time since Spring 2010.
New Hampshire
Employment at the state level, adjusted for seasonal variation, decreased for the first time in four quarters. Still, it remained up from a year ago.
Rooms and Meals Revenues
It is estimated from total tax yielded from rooms and meals sales. It tends to increase with tourism activities.
Coos County
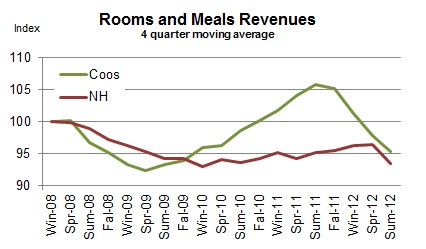
The estimated rooms and meals revenue, adjusted for inflation and smoothed by four quarter moving average, fell for the fourth consecutive quarter. On a quarterly year-over-year basis, it fell three quarters in a row.
New Hampshire
The estimated rooms and meals revenue, adjusted for inflation and smoothed by four quarter moving average, fell after increasing four straight quarters. On a quarterly year-over-year basis, it declined for the first time since Summer 2010.
Traffic Counts
It tracks the average vehicle traffic counts on Saturdays each quarter, which is automatically collected from traffic recorders located throughout the State. 12 recorders are selected to reflect traveler traffic in each of the seven travel regions in the State with two recorders from Coos County – Jefferson and Northumberland.
 Coos County
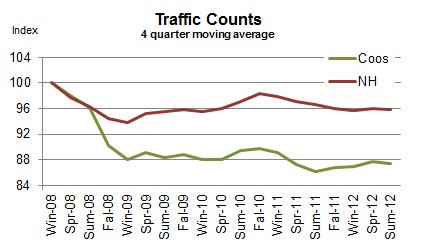
Average Saturday traffic counts, smoothed by four quarter moving average, ticked down after increasing three consecutive quarters. On a quarterly year-over-year basis, it rose two straight quarters.
New Hampshire
Average Saturday traffic counts, smoothed by four quarter moving average, inched down after a modest increase in Spring. On a quarterly year-over-year basis, it decreased for the 5th quarter in a row.
Wages and Salaries
The estimated wage and salaries disbursements represent total compensation including pay for vacation, bonuses, stock options, and tips. This data is obtained from all workers covered under state and federal unemployment insurance laws; in other words, it is full population counts, not sample-based estimates. Unlike the household employment report, however, it excludes self-employed, domestic workers, and most agricultural workers. For this difference, wages and salaries series complements the number of employed residents in monitoring the labor market conditions as well as the economy. A change in wages and salaries, adjusted for inflation, may reflect changes in the number of jobs, the ratio between part-time and full-time jobs, and wage rates.
Coos County

The estimated wages and salary disbursement, adjusted for inflation and smoothed by four quarter moving average, rose for the third quarter in a row. As a result, it turned up from a year earlier.
New Hampshire
The estimated wages and salary disbursement, adjusted for inflation and smoothed by four quarter moving average, decreased for the second time in four quarters. And, it was down from where it stood a year ago.
Industrial Electricity Sales
It measures sales of electricity (kWh) to industrial customers. Utilities categorize consumers based on the North American Industry Classification System, demand, or usages. The industrial sector includes manufacturing, construction, mining, agriculture, fishing, and forestry establishments. Among these industries, manufacturing is a primary industry in Coos County making up 69% (73% for New Hampshire in 2008) of the total number of jobs in the industrial sector mentioned above according to the 2006 QCEW data. Therefore, a rise in industrial electricity sales may largely indicate invigorating manufacturing activities in the economy.
 Coos County

Industrial electricity sales, smoothed by four quarter moving average, fell for the 6th consecutive quarter. On a quarterly year-over-year basis, it fell for the 5th consecutive quarter.
New Hampshire
Industrial electricity sales, smoothed by four quarter moving average, advanced three quarters in a row. And, it expanded two quarters in a row on a quarterly year-over-year basis.
Real Estate
NCEI reports two real estate market indicators – home sales and median home prices. The data tracks residential homes sold, including condos and manufactured homes. The health of the real estate sector is important to the broad economy due to its multiplier effect. Home transactions not only generate income for real estate brokers and mortgage bankers but also bring more businesses in other sectors including moving services, home furnishings and appliances. In order to minimize volatility in Coos real estate market, indicators are averaged over a four quarter period.
Coos County

In Summer, the Coos housing market showed a strong rebound. Home sales, smoothed by the four-quarter moving average, rose two quarters in a row on a quarterly year-over-year basis. Median home prices, smoothed by the four-quarter moving average, rose three straight quarters on a quarterly year-over-year basis.
 New Hampshire

The state’s housing market improved in both the volume of sales and prices in Summer 2012. Home sales, smoothed by the four-quarter moving average, rose four quarters in a row at an increasing pace on a quarterly year-over-year basis. Median home prices, smoothed by four-quarter moving average, were up from Spring 2012. The housing recovery is gaining momentum.
Leading Indicators
Leading indicators are to provide a sense of future economic conditions in the state of New Hampshire. The report includes 7 leading indicators grouped into three different categories – 1) four leading indicators for the broad economy of New Hampshire; 2) two leading indicators of the state’s hospitality industry; 3) a leading indicator of the U.S. economy. The list of leading indicators for New Hampshire’s economy includes initial unemployment claims, average weekly hours of work in the manufacturing industry, building permits, and new business formation; the list for the state’s hospitality industry has gas price, and Canadian dollar; the report also includes interest rate spread between 10-year Treasury and federal funds for the U.S. economy. Although the list is by no means exhaustive and indicators often do not go back long enough in time for statistically robust analysis, we believe it can still be a helpful tool. Raw data are processed so as to make it easier to detect a change in the direction of the underlying trend in the economy. In the summary table below, “up” during recession indicates recovery around the corner while “down” during an expansion signals an impending recession. During expansion, the likelihood of recession increases when more indicators turn down persistently. For example, all four leading indicators of NH economy start posting “down” month after month at the beginning of the state’s 2008 recession. The New Hampshire recessions are defined as the period of declines in the New Hampshire Coincident Index published by the Philadelphia Federal Reserve Bank.
In August 2012, two of the four leading indicators for New Hampshire were down compared to six months ago in the year-over-year growth rate.

*These series are inverted so that an “up” means an improvement. Layoff decreases (inverted layoff increases) when the labor market conditions improve; and a decrease in gas prices (an increase in inverted gas prices) may help increase the number of travelers. **”Up” or “down” in this series is a change from prior month as opposed to from 6 months ago.
 Initial Unemployment Claims

The series is inverted so that an increase means an improvement. Initial claims decrease (inverted initial claims increase) when the labor market condition improves. The number of Initial claims tends to lead the business cycle. The chart demonstrates that it correctly predicted both the beginning and the ending of the past two recessions.
Average Weekly Hours of Work in Manufacturing
It tends to turn before the economy does because employers often increase work hours of existing workers at the beginning of the recovery before committing to new hires; they do not want to take the risk of committing to new hires and seeing the economy fall back again. This data for New Hampshire only goes back to 2007.
 New Business Formation

All companies that want to do business in the state must register at the NH Secretary of State. This data includes all types of businesses including corporations and limited liabilities companies. The number of new businesses tends to lead the business cycle. Although this series goes back only to 2006, it correctly predicted the beginning and ending of the state’s 2008 recession. The series is smoothed by 12 month moving average.
Building Permits for Single Family Homes
It’s often the case housing recovery leads the broad economy out of recession. This is because of its extensive ripple effect over the rest of the economy. Building construction requires inputs from many other industries such as window manufacturing, logging, plumbing, electricity services, banking, and home furnishings such as consumer electronics and furniture. The 2001 recession was a mild recession and a rare one that did not involve a housing slump. The series is smoothed by four month moving average.
 Interest Rate Spread

The interest rate spread, the 10 year Treasury less the Federal Funds, is considered one of the best leading indicators for the national economy. The indicator is the sum of all the past values plus the spread in the current period. Therefore, it decreases when the current spread is negative (the 10 year T rate is lower than the Fed Funds Rate), which is indicative of an impending recession.
Canadian Dollar

The value of Canadian dollar (the U.S. dollar per Canadian dollar) is an important indicator of the current and future tourism activity in the State of New Hampshire. Canada is the most important source of foreign travelers in the state. An increase in the value of Canadian dollar makes travel to the U.S. more affordable for Canadians. The chart on the right shows its longer-term relationship with rooms and meals revenues.
 Gas Price

It’s the monthly average of weekly New England regular conventional retail gas prices. A significant decrease in gas prices makes traveling more affordable and can help increase the number of travelers to the state. When gas prices increase substantially, traffic counts tend to fall and vice versa. Gas prices are inverted so that an increase indicates improving conditions.
Technical Notes
- Employment is the number of people employed from the household survey.
- The current values of rooms and meals revenues are estimated using the data obtained from participating local hoteliers.
- The data series reported in the dollar values are adjusted for inflation.
- Real Estate data is obtained from the Northern New England Real Estate Network (NNEREN). All analysis and commentary related to the statistics is that of the authors, and not that of NNEREN.
© Copyright 2010: Daniel Lee and Vedran Lelas, College of Business Administration, Plymouth State University.