Economy chugged along amid severe winter weather.
In Winter 2014, the County’s economy remained on its path of economic recovery despite severe winter weather. Although the winter storms dampened the pace of growth, the County Index increased four consecutive quarters on a year-over-year basis with all five component indicators up from their 2013 winter levels. The good-producing sector started growing again; industrial electricity sales was higher than the prior year for the first time since Spring 2011. The labor market continued to improve; both number of employed residents and estimated wages and salaries were up from a year earlier. The tourism sector remained strong as well; both average Saturday vehicle traffic counts and spending at lodgings remained up from the prior year. The County’s housing market appeared to have reached a plateau; housing sales declined for the first time in two years, while the pace of increases in housing prices fell for the third quarter in a row.
The State’s economy advanced in Winter 2014. The State Index increased 14 consecutive quarters on a year-over-year basis. The pace of growth rose four straight quarters. All five component indicators remained up from the prior year. The industrial sector was stronger; industrial electricity sales grew eight consecutive quarters and its pace of growth increased two straight quarters. The labor market continued its recovery as well; both number of employed residents and estimated wages and salaries remained up from the prior year. The tourism sector grew stronger; both average Saturday vehicle traffic counts and spending at lodgings continued to grow at faster clips. However, the leading indicators showed a mixed picture regarding the future economic activity. Only one of the four state leading indicators was up in February. The state’s housing market showed signs of cooling off; the growth rate of home sales continued to decline and fell to the lowest rate in two years.
Student Report by Sean McGlynn
In struggling economic regions it is common for some students to not receive the support they need to be successful, and also for talented students to take their skills to more developed and prosperous regions. The Enriched Learning Center in Berlin, NH is helping to solve these issues in Coös County, while also providing many services to the area.
The Enriched Learning Center was formed in 2009 by Jim Cochran, who is currently the director. It is an alternative day school that aims to “help not only struggling students, but also those that simply need something other than traditional class work to remain engaged in their learning” says Cochran. The school currently has an enrollment of 14 students with a capacity for 22, and employs 6 full time staff members, as well as part time staff members, during the summer when it functions as an adventure tourism destination. “When alternative schools drop in numbers, they must drop staff, so we looked to tourism to help diversify and fund our program” says Cochran.
In the summer the ELC focuses on tourism for all ages and offers many different activities including rafting, kayaking and wildlife boat tours. With the help of the Neil and Louise Tilotson Fund they recently managed to reopen an old ropes course in a local state park and are working on turning it into a sustainable tourism destination. The ropes course will be a great resource for north country schools, youth groups and leadership programs. 1% of all ELC profits go to non-profit organizations in the area, and much of their program’s focus is on community service as well.
Every quarter the ELC picks a theme to focus its studies around; they cover their core classes but also get out in the community doing hands on projects which have previously included stocking fish hatcheries and clearing and building hiking trails in Berlin. The ELC wants students to realize the opportunities and potential of their area, and to build relationships with the community. If students are willing to think outside the box, there are plenty of opportunities for them in Coös County, especially those with a passion for the outdoors. It is the ELC’s goal to help students realize these opportunities, find a passion, and provide them with the skills and confidence needed to pursue said passion.
The ELC has a contract with New Hampshire’s Vocational Rehabilitation program and helps give people the skills they need to be employed, including leadership and teamwork skills as well as a strong general education in a more stimulating and supportive environment.
The ELC has seen success in finding students employment as well as helping them enter programs at White Mountain Community College. A recent ELC student graduated from White Mountain with a degree in heavy equipment and welding and they have also seen students go on to find employment with the Appalachian Mountain Club. WMCC is working on a new outdoor recreation program, and the ELC is “working on preparing students for a smooth transition into that program” says Cochran “with the hope that two years at WMCC will turn into 4 year programs and a bachelor degree at Plymouth State University or the University of New Hampshire”. The ELC is helping to build a strong, sustainable community in the north country, as well as educate its future leaders on all the opportunities the north country has to offer, and how to take advantage of and protect these opportunities for future generations.
Coincident Index

 The Coos Coincident Index, which tracks the current state of the Coos economy, inched up to 90.1 in Winter 2014 from Fall’s revised value of 90.0. On a quarterly year-over-year basis, the Index increased for the fourth quarter in a row.

The New Hampshire Coincident Index increased to 97.6 in Winter 2014 from Fall’s revised value of 97.3. On a quarterly year-over-year basis, the index increased for the 14th consecutive quarters.
How strong are the forces of change?
In Winter, the Coos Coincident Index rose four straight quarters. All five component indicators turned up from their Fall 2012 levels. But the pace of growth fell after increasing three straight quarters. The State Index increased for the 14th quarter in a row on a quarterly year-over-year basis. All five component indicators were up from a year ago. The pace of growth increased four quarters in a row.
Household Employment
Household employment measures the number of employed residents. In contrast to non-farm payroll employment that is more commonly used in the national and state indexes, household employment includes self-employed, unpaid domestic help and both farm and non-farm workers, all of which may be more significant in rural than urban economy. Employment tends to rise as economy grows.
 Coos County

The employment index, adjusted for seasonal variation, inched down for the second time in four quarters. On a quarterly year-over-year basis, it expanded four straight quarters after falling nine quarters in a row.
New Hampshire
Employment at the state level, adjusted for seasonal variation, rose for the fifth time in six quarters. On a quarterly year-over-year basis, it expanded 14 quarters in a row.
Rooms Revenue
Rooms revenue represents spending on accommodations paid by travelers. It’s a good hospitality sector’s indicator in the sense that it’s not an estimate, but an official count as reported by the New Hampshire Department of Revenue Administration. However, it may not fully reflect changes in the overall activity level in the hospitality sector. Although it tracks a majority of overnight travelers, it excludes day travelers and overnight travelers staying with friends and family and those who have second homes. In the case of the northern regions of the state, the effect of the drawback is less of a concern since day travelers are a small minority due to the distance from the major urban areas.
Coos County

The estimated rooms and meals revenue, adjusted for inflation and smoothed by the four quarter moving average, inched down for the first time since Fall 2012. On a quarterly year-over-year basis, it increased four straight quarters.
New Hampshire
The estimated rooms and meals revenue, adjusted for inflation and smoothed by the four quarter moving average, inched up for the fourth consecutive quarter. On a quarterly year-over-year basis, it rose four straight quarters.
Traffic Counts
It tracks the average vehicle traffic counts on Saturdays each quarter, which is automatically collected from traffic recorders located throughout the State. 12 recorders are selected to reflect traveler traffic in each of the seven travel regions in the State with two recorders from Coos County – Jefferson and Northumberland.
 Coos County

Average Saturday traffic counts, smoothed by the four quarter moving average, decreased after increasing two consecutive quarters. On a quarterly year-over-year basis, it expanded two straight quarters.
New Hampshire
Average Saturday traffic counts, smoothed by the four quarter moving average, fell after increasing three straight quarters. On a quarterly year-over-year basis, it expanded three consecutive quarters.
Wages and Salaries
The estimated wage and salaries disbursements represent total compensation including pay for vacation, bonuses, stock options, and tips. This data is obtained from all workers covered under state and federal unemployment insurance laws; in other words, it is full population counts, not sample-based estimates. Unlike the household employment report, however, it excludes self-employed, domestic workers, and most agricultural workers. For this difference, wages and salaries series complements the number of employed residents in monitoring the labor market conditions as well as the economy. A change in wages and salaries, adjusted for inflation, may reflect changes in the number of jobs, the ratio between part-time and full-time jobs, and wage rates.
Coos County

The estimated wages and salary disbursement, adjusted for inflation and smoothed by the four quarter moving average, expanded six straight quarters. On a quarterly year-over-year basis, it expanded five quarters in a row.
New Hampshire
The estimated wages and salary disbursement, adjusted for inflation and smoothed by the four quarter moving average, increased six quarters in a row. On a quarterly year-over-year basis, it increased for the sixth consecutive quarter.
Industrial Electricity Sales
It measures sales of electricity (kWh) to industrial customers. Utilities categorize consumers based on the North American Industry Classification System, demand, or usages. The industrial sector includes manufacturing, construction, mining, agriculture, fishing, and forestry establishments. Among these industries, manufacturing is a primary industry in Coos County making up 69% (73% for New Hampshire in 2008) of the total number of jobs in the industrial sector mentioned above according to the 2006 QCEW data. Therefore, a rise in industrial electricity sales may largely indicate invigorating manufacturing activities in the economy.
 Coos County

Industrial electricity sales, smoothed by four quarter moving average, rose two consecutive quarters. On a quarterly year-over-year basis, it increased for the first time since Spring 2011.
New Hampshire
Industrial electricity sales, smoothed by the four quarter moving average, rose nine straight quarters. On a quarterly year-over-year basis, it expanded eight quarters in a row.
Real Estate
NCEI reports two real estate market indicators – home sales and median home prices. The data tracks residential homes sold, including condos and manufactured homes. The health of the real estate sector is important to the broad economy due to its multiplier effect. Home transactions not only generate income for real estate brokers and mortgage bankers but also bring more businesses in other sectors including moving services, home furnishings and appliances. In order to minimize volatility in Coos real estate market, indicators are averaged over a four quarter period.
Coos County
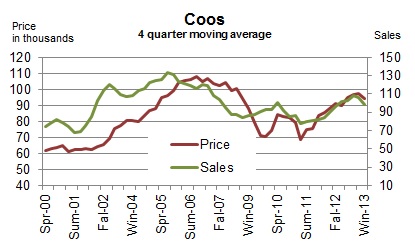
In Winter 2014, the county’s housing market appeared to have reached a plateau. The volume of home sales, smoothed by four quarter moving average, fell for the first time in two years on a year-over-year basis. The median home price, smoothed by four quarter moving average, continued to increase on a year-over-year basis. But its pace of increases declined for the third quarter in a row.
 New Hampshire
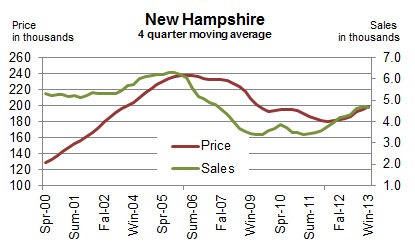
The state’s housing market also showed early signs of cooling off. The pace of growth in home sales, smoothed by the four-quarter moving average, fell to the lowest level since Winter 2012. On the other hand, the median home price, smoothed by four quarter moving average, increased at a faster clip five quarters in a row.
Leading Indicators
Leading indicators are to provide a sense of future economic conditions in the state of New Hampshire. The report includes 7 leading indicators grouped into three different categories – 1) four leading indicators for the broad economy of New Hampshire; 2) two leading indicators of the state’s hospitality industry; 3) a leading indicator of the U.S. economy. The list of leading indicators for New Hampshire’s economy includes initial unemployment claims, average weekly hours of work in the total private sector, building permits, and new business formation; the list for the state’s hospitality industry has gas price, and Canadian dollar; the report also includes interest rate spread between 10-year Treasury and federal funds for the U.S. economy. Although the list is by no means exhaustive and indicators often do not go back long enough in time for statistically robust analysis, we believe it can still be a helpful tool. Raw data are processed so as to make it easier to detect a change in the direction of the underlying trend in the economy. In the summary table below, “up” during recession indicates recovery around the corner while “down” during an expansion signals an impending recession. During expansion, the likelihood of recession increases when more indicators turn down persistently. For example, all four leading indicators of NH economy start posting “down” month after month at the beginning of the state’s 2008 recession. The New Hampshire recessions are defined as the period of declines in the New Hampshire Coincident Index published by the Philadelphia Federal Reserve Bank.
In February 2014, only one of the four leading indicators for New Hampshire was up compared to six months ago in their year-over-year growth rate.

*These series are inverted so that an “up” means an improvement. Layoff decreases (inverted layoff increases) when the labor market conditions improve; and a decrease in gas prices (an increase in inverted gas prices) may help increase the number of travelers. **”Up” or “down” in this series is a change from prior month as opposed to from 6 months ago.
 Initial Unemployment Claims
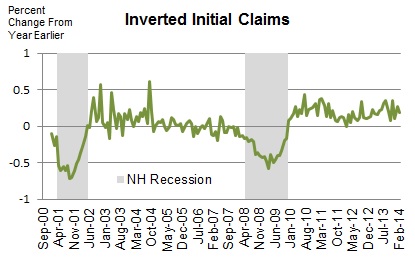
The series is inverted so that an increase means an improvement. Initial claims decrease (inverted initial claims increase) when the labor market condition improves. The number of Initial claims tends to lead the business cycle. The chart demonstrates that it correctly predicted both the beginning and the ending of the past two recessions.
Average Weekly Hours of Work in Private Sector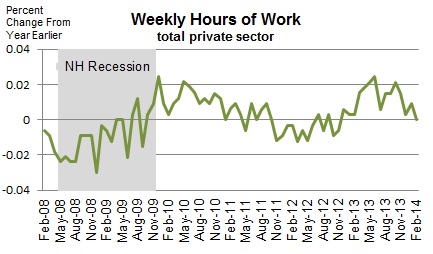
It tends to turn before the economy does because employers often increase work hours of existing workers at the beginning of the recovery before committing to new hires; they do not want to take the risk of committing to new hires and seeing the economy fall back again. This data for New Hampshire only goes back to 2007.
 New Business Formation

All companies that want to do business in the state must register at the NH Secretary of State. This data includes all types of businesses including corporations and limited liabilities companies. The number of new businesses tends to lead the business cycle. Although this series goes back only to 2006, it correctly predicted the beginning and ending of the state’s 2008 recession. The series is smoothed by 12 month moving average.
Building Permits for Single Family Homes
It’s often the case housing recovery leads the broad economy out of recession. This is because of its extensive ripple effect over the rest of the economy. Building construction requires inputs from many other industries such as window manufacturing, logging, plumbing, electricity services, banking, and home furnishings such as consumer electronics and furniture. The 2001 recession was a mild recession and a rare one that did not involve a housing slump. The series is smoothed by four month moving average.
 Interest Rate Spread

The interest rate spread, the 10 year Treasury less the Federal Funds, is considered one of the best leading indicators for the national economy. The indicator is the sum of all the past values plus the spread in the current period. Therefore, it decreases when the current spread is negative (the 10 year T rate is lower than the Fed Funds Rate), which is indicative of an impending recession.
Canadian Dollar
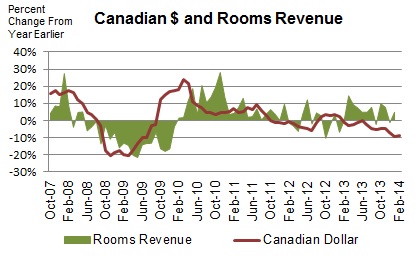
The value of Canadian dollar (the U.S. dollar per Canadian dollar) is an important indicator of the current and future tourism activity in the State of New Hampshire. Canada is the most important source of foreign travelers in the state. An increase in the value of Canadian dollar makes travel to the U.S. more affordable for Canadians. The chart on the right shows its recent relationship with spending on accommodations by travelers.
 Gas Price

It’s the monthly average of weekly New England regular conventional retail gas prices. A significant decrease in gas prices makes traveling more affordable and can help increase the number of travelers to the state. When gas prices increase substantially, traffic counts tend to fall and vice versa. Gas prices are inverted so that an increase indicates improving conditions.
Technical Notes
- Employment is the number of people employed from the household survey.
- The current values of rooms and meals revenues are estimated using the data obtained from participating local hoteliers.
- The data series reported in the dollar values are adjusted for inflation.
- Real Estate data is obtained from the Northern New England Real Estate Network (NNEREN). All analysis and commentary related to the statistics is that of the authors, and not that of NNEREN.
© Copyright 2010: Daniel Lee and Vedran Lelas, College of Business Administration, Plymouth State University.