Coos and New Hampshire part ways to recovery.
In September, the Coos economy was still in the mud. The housing market showed no signs of recovery from the expiration of the home buyer tax credits. The number of homes sold remained nearly half the level seen a year ago. The production activity took a sudden plunge; the industrial electricity sales plummeted. Hoteliers in the region told that many in the industry would go out of business unless the economy turned around soon. The data coincided with the sentiment. Both the estimated rooms and meals revenues and the average Saturday vehicle traffic counts were down from a year ago. On a positive note, though, the labor market advanced. The number of employed residents was up from the level seen a year ago for the first time since February 2008.
On the other hand, the revised data revealed that the State economy may have resumed its course to recovery. Both the labor market and the housing sector brought encouraging signs. The rate of increase in the number of employed residents on a month-to-month basis, which had steadily slowed to fall into the negative territory in July, has since bounced back and reaccelerated. The number of homes sold, although still lower than where it stood a year ago, continued to recover from the hick ups after the expiration of the federal home buyer tax credits. The manufacturing sector remained as strength of the economy, as indicated in the industrial electricity sales. The hospitality industry also did better than a year ago. The estimated rooms and meals revenues kept up on a year-over-year basis.
Coincident Index


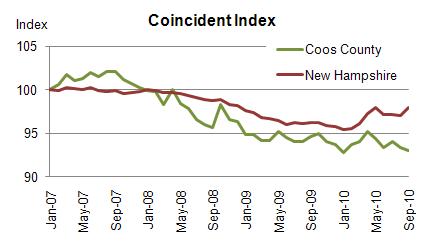
The Coos Coincident Index, which tracks the current state of the Coos economy, slipped to 93.0 in September from August’s revised value of 93.4, for a loss of 0.4%. On a monthly year-over-year basis, the Index decreased 1.7% from its September 2009 value for the fourth time in five months. The loss was the largest since January.
The New Hampshire Coincident Index rebounded to 97.9 in September from August’s revised level of 97.0. On a monthly year-over-year basis, the Index rose six months in a row. The gain was the largest since the beginning of the latest recession.
How strong are the forces of change?
In September, the Coos Coincident Index dropped for the fourth time in five months on a monthly year-over-year basis. The loss was the largest since February. Four out of six component indicators were down from where they were a year ago. In the meantime, the revised data revealed that the State Index advanced six months in a row at a rate unseen since the beginning of the latest recession. Four of the six component indicators were up from where they were a year ago, contributing to this gain.
Household Employment
Household employment measures the number of employed residents. In contrast to non-farm payroll employment that is more commonly used in the national and state indexes, household employment includes self-employed, unpaid domestic help and both farm and non-farm workers, all of which may be more significant in rural than urban economy. Employment tends to rise as economy grows.
 Coos County

Employment index, adjusted for seasonal variation, expanded by 1.8%, the largest since February. More notably, it was up from where it was a year ago for the first time since February 2008.
New Hampshire
Employment at the state level, adjusted for seasonal variation, was stagnant, but was still up from its September 2009 level.
Home Sales
It tracks the number of residential homes sold, including condos and manufactured homes. Home transactions not only generate income for real estate brokers and mortgage bankers but also bring more businesses in other sectors including moving services, home furnishings and appliances. The latter is particularly true for new home sales. In interpreting percentage changes in the County’s home sales data, though, one should note that percentage changes can be highly volatile due to small sales volumes.
Coos County

Home sales, adjusted for seasonal variation, nearly unchanged from the previous month. As a result, it remained practically half the September 2009 level.
New Hampshire
Home sales, adjusted for seasonal variation, advanced two months in a row after taking a plunge in August. Still, it was down from where it stood in September 2009.
Rooms and Meals Revenues
It is estimated from total tax yielded from rooms and meals sales. It tends to increase with tourism activities.
 Coos County

The estimated rooms and meals revenue, adjusted for seasonal variation and inflation, retreated for the second consecutive month. It fell below where it was a year ago for the first time since May.
New Hampshire
The estimated rooms and meals revenue, adjusted for seasonal variation and inflation, bounced back in September. And, it was up from where it was a year ago.
Traffic Counts
It tracks the average vehicle traffic counts on Saturdays each month, which is automatically collected from traffic recorders located throughout the State. Two recorders are placed in the Coos county – Jefferson and Northumberland.
Coos County

Average Saturday traffic counts, adjusted for seasonal variation, took a plunge in September. And, it fell below where it was a year ago.
New Hampshire
Average Saturday traffic counts, adjusted for seasonal variation, slipped in September for the second straight months. And, it was down from where it was a year ago.
Wages and Salaries
The estimated wage and salaries disbursements represent total compensation including pay for vacation, bonuses, stock options, and tips. This data is obtained from all workers covered under state and federal unemployment insurance laws; in other words, it is full population counts, not sample-based estimates. Unlike the household employment report, however, it excludes self-employed, domestic workers, and most agricultural workers. For this difference, wages and salaries series complements the number of employed residents in monitoring the labor market conditions as well as the economy. A change in wages and salaries, adjusted for inflation, may reflect changes in the number of jobs, the ratio between part-time and full-time jobs, and wage rates.
 Coos County

The estimated wages and salary disbursement, adjusted for seasonal variation and inflation, increased in September. Still, it was down from its September 2009 level.
New Hampshire
The estimated wages and salary disbursement, adjusted for seasonal variation and inflation, fell in September. Still, it was up from where it stood a year ago.
Industrial Electricity Sales
It measures sales of electricity (kWh) to industrial customers. Utilities categorize consumers based on the North American Industry Classification System, demand, or usages. The industrial sector includes manufacturing, construction, mining, agriculture, fishing, and forestry establishments. Among these industries, manufacturing is a primary industry in Coos County making up 69% (73% for New Hampshire in 2008) of the total number of jobs in the industrial sector mentioned above according to the 2006 QCEW data. Therefore, a rise in industrial electricity sales may largely indicate invigorating manufacturing activities in the economy. But one should take caution in interpreting this indicator since its changes may also reflect changes in rates or reclassification of consumers between the industrial and commercial sectors.
Coos County

Industrial electricity sales, adjusted for seasonal variation, took a nosedive in September. As a result, it fell below where it was a year ago.
New Hampshire
Industrial electricity sales, adjusted for seasonal variation, inched up after falling in August. And, it remained up from where it was a year ago.
Month-to-Month Comparison vs. Year-over-Year Comparison
Interpreting economic indicators may not be as easy as it might seem. This is particularly true when dealing with regional indicators that tend to be highly volatile. The month-to-month changes can be very volatile and may not represent true changes in economic conditions. To reduce the volatility and better detect the underlying trend in the economy, economists often use the year-over-year percent changes. However, this year-over-year percent comparison has a problem of its own. It doesn’t tell us anything about what happened between a year ago and the current period. It misses out the most recent changes in the economy. The recent changes should be reflected in the month-to-month percent changes. The bottom line is that one should be careful in interpreting economic indicators and should examine both the month-to-month changes and the year-over-year changes to get a good sense of what is happening in the economy. In addition, one should also apply the 3 Ds principle in interpreting economic indicators. The 3 Ds are duration (how persistent the change has been), diffusion (how widespread the change is) and depth (how large the change is). Refer to “How should economic index be interpreted?” on the About page.
Leading Indicators
This section is under construction. The future reports will include building permits, initial unemployment claims, new business formation, real estate indicators and possibly freight volumes.
Technical Notes
- Employment is the number of people employed from the household survey.
- The current values of rooms and meals revenues are estimated using the data obtained from participating local hoteliers.
- The quarterly wages and salary disbursements are smoothed into the monthly series after the current values are estimated.
- These models to estimate the current values of rooms and meals revenues and wages and salary disbursements are re estimated once a year in February using updated data.
- The data series reported in the dollar values are adjusted for inflation.
- The data series are adjusted for seasonal variation when identifiable seasonality is present.
- Seasonal factors are recalculated once a year in February using updated data. Thus, the seasonally adjusted data series are to be revised accordingly.
- Real Estate data is obtained from the Northern New England Real Estate Network (NNEREN). All analysis and commentary related to the statistics is that of the authors, and not that of NNEREN.
© Copyright 2010: Daniel Lee and Vedran Lelas, College of Business Administration, Plymouth State University.