Stalling New Hampshire’s Economy
[innerindex]In Fall 2012, the Coos Index fell for seven quarters in a row on a quarterly year-over-year basis. The pace of decline resumed acceleration after slowing in Spring and Summer 2012. Four of five component indicators were down from a year ago. The number of employed residents, average Saturday traffic counts, estimated rooms and meals revenue and industrial electricity sales all decreased from prior year, while estimated wages and salaries of covered employment were up. On a positive note, the housing market continued to rebound strongly; home sales increased three quarters in a row on a quarterly year-over-year basis and median home prices rose four consecutive quarters.In Fall 2012, the State economy remained on a long-term growth path. However, recent developments were worrisome. The revised State Index stalled at 96.2 for two consecutive quarters. Particularly worrisome was the labor market; both the number of employed residents and estimated wages and salaries were down from Summer 2012. In addition, all four leading indicators for the state economy turned down in November 2012. Although it’s too early to tell whether the changes in the leading indicators signal a change in the underlying trend, they, together with the sluggish labor market, seem to be indicative of an increasingly vulnerable state of the economy in New Hampshire. On a positive note, the hospitality industry kept the economy afloat; both estimated rooms and meals receipts and average Saturday traffic counts were up from a year ago. In addition, the state’s housing market continued a strong rebound; home sales rose five quarters in a row and median home prices were higher than summer 2012.
Student Report by Ryan Bernier
Coos County: The Prime Location for ATV/OHRV Riders
As community developers attempt to transition Berlin and surrounding towns from their prior status as manufacturing towns, many stakeholders are finding that a practical approach to economic development has been to utilize the surrounding natural resources. This appears to have already been a success with the renaissance of biomass, in home heating and in the 75 mega-watt Burgess Biomass Power Plant (see September’s report for more information). In addition to biomass, there is plenty of space in the Great North Woods to provide outdoor enthusiasts the opportunity to enjoy the natural features of Northern New Hampshire. The Jericho Mountain State Park and its large off-highway-recreational-vehicles (OHRV) trail network is an ongoing effort to utilize this natural space. When finished, the trails will connect the communities of Berlin, Northumberland, Errol and Pittsburg.
The land that has become the Jericho Mountain State Park was originally purchased from the Dillon Company in 2006 by the New Hampshire Department of Resources and Economic Development (DRED). The Park is located within the city limits of Berlin, and is easily accessed via Route 110 by car or by way of the town-connector route which was built especially for ATVs. The connector route allows ATVs to drive on designated streets in down town Berlin. The basic goal of those involved in the project is to make this one of the premier destinations for off-highway-recreational-vehicles (OHRV) enthusiasts from New Hampshire as well as from out of state. According to a report from Horizons Engineering, a Littleton-based company, when finished, Jericho Mountain State Park and its trail network will be one of the largest and most comprehensive public OHRV systems in the country.1
Additional features that have been added or will be added include a main parking lot with 160 spaces and a general store that will sell food, as well as convenience and repair items. The park also has many features that are of interest to people who are not interested in riding on the trails including a campground, a beach, swimming, canoeing, fishing, and picnicking at Jericho Lake.2 Since the park can be utilized by a number of OHRV vehicles it may be accessed heavily by visitors during three of the four seasons; summer, fall and winter (primarily snowmobiles). The spring season will likely decrease use, due to “mud season.”
No one knows the extent to which this Park and its vast trail network will impact the local economy, however if the ATV Festivals, which have been held for three straight years here are any indication, the future looks to be quite bright. The third annual ATV Festival was held at the park this past July and attendance increased from the prior year as it did in 2011. According to Berlin city planner Pamela Laflamme, “the event was a huge success with very little marketing.” Perhaps this indicates that there is an energetic base of people who are very interested in attending the festival and using the trails. The more the event grows in the future, the more notoriety Berlin and surrounding towns stand to gain and the greater the economic multipliers associated with the Park will be. Furthermore as the trails continue to expand north, the opportunity exists for communities other than Berlin to benefit from the increased presence of OHRV riders.
1 (2007). Jericho Mountain State Park: Riding area master trail development plan. (pg. 2) Prepared for, NH Department of Resource and Economic Development. Horizons Engineering: Littleton, NH.
2 (2012). “Jericho Mountain State Park.” Parks and Recreation NH. Retrieved from
http://www.nhstateparks.org/explore/state-parks/jericho-mountain-state-park.aspx
Coincident Index

 The Coos Coincident Index, which tracks the current state of the Coos economy, fell to 88.1 in Fall 2012 from Summer’s revised value of 88.8. On a quarterly year-over-year basis, the Index declined for the 7th quarter in a row.

The New Hampshire Coincident Index changed little in Fall 2012 from Summer’s revised value of 96.2. On a quarterly year-over-year basis, the index remained up from a year ago.
How strong are the forces of change?
In Fall, the Coos Coincident Index fell for the 7th quarter in a row on a quarterly year-over-year basis. All but one component indicator turned down from their Fall 2011 levels. The pace of decline ticked up after falling two consecutive months. The State Index stalled at 96.2 for the second quarter in a row. Still, it remained up from a year ago, with four of the five component indicators higher than where they stood at the same time a year ago.
Household Employment
Household employment measures the number of employed residents. In contrast to non-farm payroll employment that is more commonly used in the national and state indexes, household employment includes self-employed, unpaid domestic help and both farm and non-farm workers, all of which may be more significant in rural than urban economy. Employment tends to rise as economy grows.
 Coos County

The employment index, adjusted for seasonal variation, contracted for the third time in five quarters. On a quarterly year-over-year basis, it fell back after increasing for the first time since Summer 2010.
New Hampshire
Employment at the state level, adjusted for seasonal variation, decreased for the second quarter in a row. On a quarterly year-over-year basis, it decreased for the first time since Summer 2010.
Rooms and Meals Revenues
It is estimated from total tax yielded from rooms and meals sales. It tends to increase with tourism activities.
Coos County
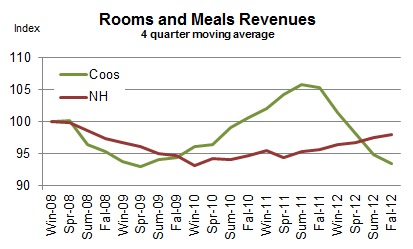
The estimated rooms and meals revenue, adjusted for inflation and smoothed by the four quarter moving average, fell for the fifth consecutive quarter. On a quarterly year-over-year basis, it fell four quarters in a row.
New Hampshire
The estimated rooms and meals revenue, adjusted for inflation and smoothed by the four quarter moving average, increased six straight quarters. On a quarterly year-over-year basis, it rose nine straight quarters.
Traffic Counts
It tracks the average vehicle traffic counts on Saturdays each quarter, which is automatically collected from traffic recorders located throughout the State. 12 recorders are selected to reflect traveler traffic in each of the seven travel regions in the State with two recorders from Coos County – Jefferson and Northumberland.
 Coos County

Average Saturday traffic counts, smoothed by the four quarter moving average, decreased two consecutive quarters. On a quarterly year-over-year basis, it declined after rising two straight quarters.
New Hampshire
Average Saturday traffic counts, smoothed by the four quarter moving average, inched up for the second time in four quarters. On a quarterly year-over-year basis, it turned up after decreasing five quarters in a row.
Wages and Salaries
The estimated wage and salaries disbursements represent total compensation including pay for vacation, bonuses, stock options, and tips. This data is obtained from all workers covered under state and federal unemployment insurance laws; in other words, it is full population counts, not sample-based estimates. Unlike the household employment report, however, it excludes self-employed, domestic workers, and most agricultural workers. For this difference, wages and salaries series complements the number of employed residents in monitoring the labor market conditions as well as the economy. A change in wages and salaries, adjusted for inflation, may reflect changes in the number of jobs, the ratio between part-time and full-time jobs, and wage rates.
Coos County
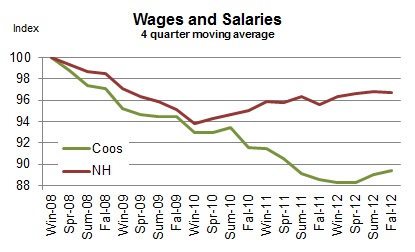
The estimated wages and salary disbursement, adjusted for inflation and smoothed by the four quarter moving average, rose for the third quarter in a row. On a quarterly year-over-year basis, it increased for the first time since the recession.
New Hampshire
The estimated wages and salary disbursement, adjusted for inflation and smoothed by the four quarter moving average, decreased for the first time in four quarters. Still, it remained up from where it stood a year ago.
Industrial Electricity Sales
It measures sales of electricity (kWh) to industrial customers. Utilities categorize consumers based on the North American Industry Classification System, demand, or usages. The industrial sector includes manufacturing, construction, mining, agriculture, fishing, and forestry establishments. Among these industries, manufacturing is a primary industry in Coos County making up 69% (73% for New Hampshire in 2008) of the total number of jobs in the industrial sector mentioned above according to the 2006 QCEW data. Therefore, a rise in industrial electricity sales may largely indicate invigorating manufacturing activities in the economy.
 Coos County

Industrial electricity sales, smoothed by four quarter moving average, fell for the 7th consecutive quarter. On a quarterly year-over-year basis, it fell for the 6th consecutive quarter.
New Hampshire
Industrial electricity sales, smoothed by the four quarter moving average, changed little. On a quarterly year-over-year basis, however, it expanded three quarters in a row.
Real Estate
NCEI reports two real estate market indicators – home sales and median home prices. The data tracks residential homes sold, including condos and manufactured homes. The health of the real estate sector is important to the broad economy due to its multiplier effect. Home transactions not only generate income for real estate brokers and mortgage bankers but also bring more businesses in other sectors including moving services, home furnishings and appliances. In order to minimize volatility in Coos real estate market, indicators are averaged over a four quarter period.
Coos County
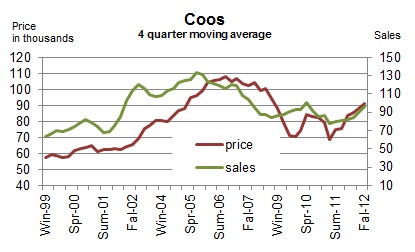
Fall 2012 continued an upward trend in the Coos housing market. Home sales, smoothed by the four-quarter moving average, rose three quarters in a row at an increasing pace on a quarterly year-over-year basis. Median home prices, smoothed by the four-quarter moving average, rose four straight quarters on a quarterly year-over-year basis.
 New Hampshire

The state’s housing market followed the footsteps of its Coos counterpart and continued to show improvements. Home sales, smoothed by the four-quarter moving average, rose five quarters in a row at an increasing pace on a quarterly year-over-year basis. Median home prices, smoothed by four-quarter moving average, were up from Summer 2012. The housing recovery is gaining momentum.
Leading Indicators
Leading indicators are to provide a sense of future economic conditions in the state of New Hampshire. The report includes 7 leading indicators grouped into three different categories – 1) four leading indicators for the broad economy of New Hampshire; 2) two leading indicators of the state’s hospitality industry; 3) a leading indicator of the U.S. economy. The list of leading indicators for New Hampshire’s economy includes initial unemployment claims, average weekly hours of work in the manufacturing industry, building permits, and new business formation; the list for the state’s hospitality industry has gas price, and Canadian dollar; the report also includes interest rate spread between 10-year Treasury and federal funds for the U.S. economy. Although the list is by no means exhaustive and indicators often do not go back long enough in time for statistically robust analysis, we believe it can still be a helpful tool. Raw data are processed so as to make it easier to detect a change in the direction of the underlying trend in the economy. In the summary table below, “up” during recession indicates recovery around the corner while “down” during an expansion signals an impending recession. During expansion, the likelihood of recession increases when more indicators turn down persistently. For example, all four leading indicators of NH economy start posting “down” month after month at the beginning of the state’s 2008 recession. The New Hampshire recessions are defined as the period of declines in the New Hampshire Coincident Index published by the Philadelphia Federal Reserve Bank.
In November 2012, all four leading indicators for New Hampshire were down compared to six months ago in their year-over-year growth rate.

*These series are inverted so that an “up” means an improvement. Layoff decreases (inverted layoff increases) when the labor market conditions improve; and a decrease in gas prices (an increase in inverted gas prices) may help increase the number of travelers. **”Up” or “down” in this series is a change from prior month as opposed to from 6 months ago.
 Initial Unemployment Claims

The series is inverted so that an increase means an improvement. Initial claims decrease (inverted initial claims increase) when the labor market condition improves. The number of Initial claims tends to lead the business cycle. The chart demonstrates that it correctly predicted both the beginning and the ending of the past two recessions.
Average Weekly Hours of Work in Manufacturing
It tends to turn before the economy does because employers often increase work hours of existing workers at the beginning of the recovery before committing to new hires; they do not want to take the risk of committing to new hires and seeing the economy fall back again. This data for New Hampshire only goes back to 2007.
 New Business Formation
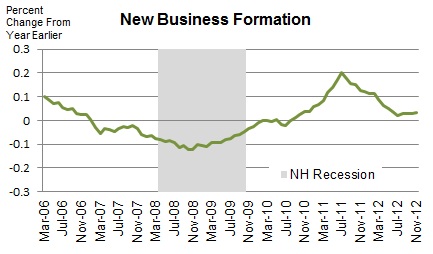
All companies that want to do business in the state must register at the NH Secretary of State. This data includes all types of businesses including corporations and limited liabilities companies. The number of new businesses tends to lead the business cycle. Although this series goes back only to 2006, it correctly predicted the beginning and ending of the state’s 2008 recession. The series is smoothed by 12 month moving average.
Building Permits for Single Family Homes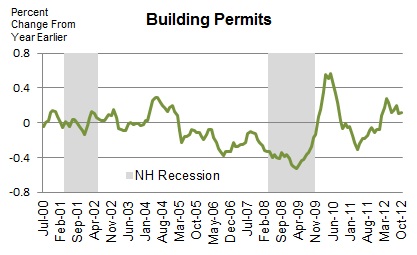
It’s often the case housing recovery leads the broad economy out of recession. This is because of its extensive ripple effect over the rest of the economy. Building construction requires inputs from many other industries such as window manufacturing, logging, plumbing, electricity services, banking, and home furnishings such as consumer electronics and furniture. The 2001 recession was a mild recession and a rare one that did not involve a housing slump. The series is smoothed by four month moving average.
 Interest Rate Spread

The interest rate spread, the 10 year Treasury less the Federal Funds, is considered one of the best leading indicators for the national economy. The indicator is the sum of all the past values plus the spread in the current period. Therefore, it decreases when the current spread is negative (the 10 year T rate is lower than the Fed Funds Rate), which is indicative of an impending recession.
Canadian Dollar
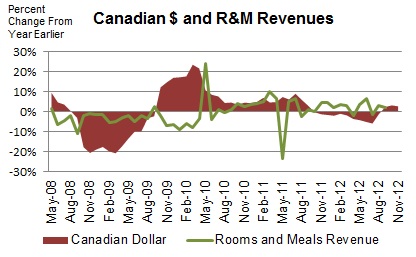
The value of Canadian dollar (the U.S. dollar per Canadian dollar) is an important indicator of the current and future tourism activity in the State of New Hampshire. Canada is the most important source of foreign travelers in the state. An increase in the value of Canadian dollar makes travel to the U.S. more affordable for Canadians. The chart on the right shows its longer-term relationship with rooms and meals revenues.
 Gas Price
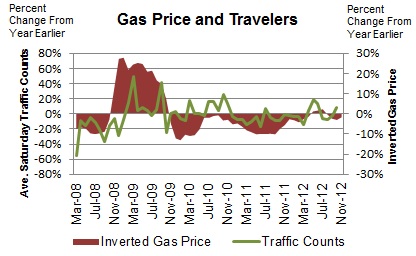
It’s the monthly average of weekly New England regular conventional retail gas prices. A significant decrease in gas prices makes traveling more affordable and can help increase the number of travelers to the state. When gas prices increase substantially, traffic counts tend to fall and vice versa. Gas prices are inverted so that an increase indicates improving conditions.
Technical Notes
- Employment is the number of people employed from the household survey.
- The current values of rooms and meals revenues are estimated using the data obtained from participating local hoteliers.
- The data series reported in the dollar values are adjusted for inflation.
- Real Estate data is obtained from the Northern New England Real Estate Network (NNEREN). All analysis and commentary related to the statistics is that of the authors, and not that of NNEREN.
© Copyright 2010: Daniel Lee and Vedran Lelas, College of Business Administration, Plymouth State University.