Tourism sector rise while rest of the economy fall.
The economic activity decreased in Coos County in fall 2014. The County Index fell for the third consecutive quarter on a year-over-year basis. The broad economy faltered; number of employed residents fell three straight quarters at an accelerating pace while wages and salaries also decreased for the third quarter in a row. The goods-producing sector weakened; industrial electricity sales decreased two consecutive quarters on a year-over-year basis. On a bright side, the tourism sector continued to expand; average Saturday vehicle traffic counts increased five consecutive quarters while spending at lodgings rose for the seventh straight quarter. The County’s housing market fell further; both housing sales and median home prices were lower than their fall 2013 levels.
The State’s economic growth slowed in fall 2014. Although the State Index increased for the 17th consecutive quarter on a quarterly year-over-year basis, the slowdown is evident in all component indicators. The industrial sector lost steam; although industrial electricity sales grew 11 consecutive quarters, its pace of growth fell two straight quarters. A similar trend was reflected in the labor market; the pace of increases in the number of employed residents decelerated since spring 2014. The tourism sector wasn’t an exception; the growth rates of both traveler spending at lodgings and average Saturday vehicle traffic counts were almost halved from their winter 2013 growth rates. However, all this may not mean an impending recession; the state economy’s leading indicators all pointed to a brighter future. The state’s housing market continued to cool off; the volume of home sales declined for the second straight quarter.
Student Report by Sean McGlynn
While the data shows that Coös County’s economy cooled off this summer, the tourism sector showed continued growth. Some local business owners see tourism as a key to a successful, diverse economy in the North Country. Two business leaders working to strengthen the tourism market in Coös are Mark Peabody, owner of Mahoosuc Inn, Mahoosuc Outdoors, and North Woods Rafting in Milan, New Hampshire and Jim Cochran, owner of the Enriched Learning Center and ELC Outdoors in Berlin, New Hampshire.
Both Cochran and Peabody highlight a lack of available lodging and short visitations as two areas where North Country tourism can focus its efforts. “We’ve got everything up here; the Mahoosuc Mountain Range, great lakes and rivers for fishing, untapped rock climbing…we’ve got it all. Except lodging,” says Mark Peabody, owner of the Mahoosuc Inn in Milan, New Hampshire.
To counter this lack of lodging Peabody and Cochran are going to be installing yurts, a type of portable tent-like structure. Yurts are a great option for those that want to get outdoors, but are not interested in traditional camping. Their portability allows them to be set up strategically along dog sledding trails, near rafting launch locations, or anywhere else extra accommodation may be required. The yurts would most likely be used by groups signed up for one of Peabody’s or Cochran’s various outdoor adventure offerings.
Currently, Peabody’s Mahoosuc Inn and Outdoors company offers horseback riding and dog sledding outings, as well as rafting on the Androscoggin, Ammonoosuc, and Magalloway Rivers, among others. During the summer months, when he is not directing the Enriched Learning Center, Cochran also runs rafting trips on the Magalloway, Androscoggin, Rapid and Kennebec Rivers. Cochran has recently opened a ropes course in Errol, New Hampshire to pair with his rafting adventures and wildlife tours.
Due to the success of his current rafting ventures, Cochran was contacted by the Economic Development Team of Pittsburgh to test the feasibility of launching trips on the Connecticut River in Pittsburgh, New Hampshire. Cochran ran free test runs during August with great success, and wants to do more planned runs this year. Cochran wants to make sure that if the new rafting launch location is developed, that it will be done correctly, without harming current businesses, guides, fishermen or the environment.
“The biggest hurdle is making sure the community is willing to look at change and to consider different options,” says Cochran. “We want to create a community forum where all the stakeholders can voice their concerns, and any possible impacts can be addressed.”
Despite their naturally competing businesses, Cochran and Peabody recognize that by collaborating they can better meet the needs of their customers and help both businesses to grow. “At this point there is no one company that has it all under their roof. In order to satisfy needs it’s logical to work with another company that is offering something I don’t,” says Peabody. “I only do business with people that value an extremely high quality experience. That’s why I do business with Jim Cochran.”
“We’re trying to really set an example of how businesses up here need to work collaboratively,” says Cochran.
Both Cochran and Peabody know the importance of diversification for not only their own businesses, but the economy in general. A diverse array of options will help keep visitors in the area for extra days, and help bring money to local restaurants and shops. While Peabody admits that the ATVs are an important aspect of the outdoor tourism economy, at times he feels they get too much focus. “I get concerned that the powers are putting all their eggs in one basket sometimes, they need to focus on other things. They haven’t diversified enough; there are so many aspects to the outdoor adventure economy,” says Peabody.
With all of the natural attributes that Coös County has to offer there is plenty of room for adventure tourism to continue to grow and diversify, hopefully leading to longer visits and more spending within the county.
Coincident Index

 The Coos Coincident Index, which tracks the current state of the Coos economy, fell to 87.7 in Fall 2014 from Summer’s revised value of 88.3. On a quarterly year-over-year basis, the Index decreased for the third quarter in a row.
 The New Hampshire Coincident Index inched down to 98.5 in Fall 2014 from Summer’s revised value of 98.6. On a quarterly year-over-year basis, the index increased for the 17th consecutive quarters.
How strong are the forces of change?
In Fall 2014, the Coos Coincident Index decreased three straight quarters on a quarterly year-over-year basis. The pace of declines accelerated during this period. Three of the five component indicators turned down from their fall 2013 levels. The State Index increased for the 17th quarter in a row on a quarterly year-over-year basis. All five component indicators remained up from a year ago. However, the pace of growth fell two quarters in a row.
Household Employment
Household employment measures the number of employed residents. In contrast to non-farm payroll employment that is more commonly used in the national and state indexes, household employment includes self-employed, unpaid domestic help and both farm and non-farm workers, all of which may be more significant in rural than urban economy. Employment tends to rise as economy grows.
 Rooms Revenue
Rooms revenue represents spending on accommodations paid by travelers. It’s a good hospitality sector’s indicator in the sense that it’s not an estimate, but an official count as reported by the New Hampshire Department of Revenue Administration. However, it may not fully reflect changes in the overall activity level in the hospitality sector. Although it tracks a majority of overnight travelers, it excludes day travelers and overnight travelers staying with friends and family and those who have second homes. In the case of the northern regions of the state, the effect of the drawback is less of a concern since day travelers are a small minority due to the distance from the major urban areas.
Traffic Counts
It tracks the average vehicle traffic counts on Saturdays each quarter, which is automatically collected from traffic recorders located throughout the State. 12 recorders are selected to reflect traveler traffic in each of the seven travel regions in the State with two recorders from Coos County – Jefferson and Northumberland.
 Wages and Salaries
The estimated wage and salaries disbursements represent total compensation including pay for vacation, bonuses, stock options, and tips. This data is obtained from all workers covered under state and federal unemployment insurance laws; in other words, it is full population counts, not sample-based estimates. Unlike the household employment report, however, it excludes self-employed, domestic workers, and most agricultural workers. For this difference, wages and salaries series complements the number of employed residents in monitoring the labor market conditions as well as the economy. A change in wages and salaries, adjusted for inflation, may reflect changes in the number of jobs, the ratio between part-time and full-time jobs, and wage rates.
Industrial Electricity Sales
It measures sales of electricity (kWh) to industrial customers. Utilities categorize consumers based on the North American Industry Classification System, demand, or usages. The industrial sector includes manufacturing, construction, mining, agriculture, fishing, and forestry establishments. Among these industries, manufacturing is a primary industry in Coos County making up 69% (73% for New Hampshire in 2008) of the total number of jobs in the industrial sector mentioned above according to the 2006 QCEW data. Therefore, a rise in industrial electricity sales may largely indicate invigorating manufacturing activities in the economy.
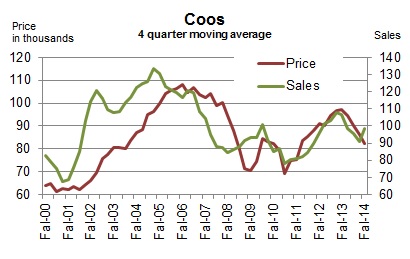
Real Estate
NCEI reports two real estate market indicators – home sales and median home prices. The data tracks residential homes sold, including condos and manufactured homes. The health of the real estate sector is important to the broad economy due to its multiplier effect. Home transactions not only generate income for real estate brokers and mortgage bankers but also bring more businesses in other sectors including moving services, home furnishings and appliances. In order to minimize volatility in Coos real estate market, indicators are averaged over a four quarter period.
 Coos County
In Summer 2014, the county’s housing market dampened. The volume of home sales, smoothed by four quarter moving average, fell three quarters in a row on a year-over-year basis. The median home price, smoothed by four quarter moving average, decreased for the second straight quarter on a year-over-year basis.
New Hampshire
The state’s housing market cooled off. The volume of home sales, smoothed by the four-quarter moving average, decreased for the first time since Summer 2011. The pace of increases in median home price, smoothed by four quarter moving average, decreased for the second consecutive quarter.
Leading Indicators
Leading indicators are to provide a sense of future economic conditions in the state of New Hampshire. The report includes 7 leading indicators grouped into three different categories – 1) four leading indicators for the broad economy of New Hampshire; 2) two leading indicators of the state’s hospitality industry; 3) a leading indicator of the U.S. economy. The list of leading indicators for New Hampshire’s economy includes initial unemployment claims, average weekly hours of work in the total private sector, building permits, and new business formation; the list for the state’s hospitality industry has gas price, and Canadian dollar; the report also includes interest rate spread between 10-year Treasury and federal funds for the U.S. economy. Although the list is by no means exhaustive and indicators often do not go back long enough in time for statistically robust analysis, we believe it can still be a helpful tool. Raw data are processed so as to make it easier to detect a change in the direction of the underlying trend in the economy. In the summary table below, “up” during recession indicates recovery around the corner while “down” during an expansion signals an impending recession. During expansion, the likelihood of recession increases when more indicators turn down persistently. For example, all four leading indicators of NH economy start posting “down” month after month at the beginning of the state’s 2008 recession. The New Hampshire recessions are defined as the period of declines in the New Hampshire Coincident Index published by the Philadelphia Federal Reserve Bank.
In November 2014, all four New Hampshire leading indicators were up compared to six months ago in their year-over-year growth rate.
 *This series is inverted so that an “up” means an improvement. Layoffs decrease (inverted layoff increases) when the labor market conditions improve.
**”Up” or “down” is a change in the spread from prior month.
***”Up” or “down” is a change in the Index from six month ago.
 Initial Unemployment Claims
The series is inverted so that an increase means an improvement. Initial claims decrease (inverted initial claims increase) when the labor market condition improves. The number of Initial claims tends to lead the business cycle. The chart demonstrates that it correctly predicted both the beginning and the ending of the past two recessions.
Average Weekly Hours of Work in Private Sector
It tends to turn before the economy does because employers often increase work hours of existing workers at the beginning of the recovery before committing to new hires; they do not want to take the risk of committing to new hires and seeing the economy fall back again. This data for New Hampshire only goes back to 2007.
 New Business Formation
All companies that want to do business in the state must register at the NH Secretary of State. This data includes all types of businesses including corporations and limited liabilities companies. The number of new businesses tends to lead the business cycle. Although this series goes back only to 2006, it correctly predicted the beginning and ending of the state’s 2008 recession. The series is smoothed by 12 month moving average.
Building Permits for Single Family Homes
It’s often the case housing recovery leads the broad economy out of recession. This is because of its extensive ripple effect over the rest of the economy. Building construction requires inputs from many other industries such as window manufacturing, logging, plumbing, electricity services, banking, and home furnishings such as consumer electronics and furniture. The 2001 recession was a mild recession and a rare one that did not involve a housing slump. The series is smoothed by four month moving average.
Interest Rate Spread
The interest rate spread, the 10 year Treasury less the Federal Funds, is considered one of the best leading indicators for the national economy. The indicator is the sum of all the past values plus the spread in the current period. Therefore, it decreases when the current spread is negative (the 10 year T rate is lower than the Fed Funds Rate), which is indicative of an impending recession.
Massachusetts Leading Index
The state of Massachusetts economy is critical for the New Hampshire’s tourism industry, since the largest share of visitors to New Hampshire come from Massachusetts. Therefore, the Massachusetts Leading Index may also shed light on the future performance of the New Hampshire’s tourism industry. The MA Leading Index is published by the Philadelphia Federal Reserve Bank. A New Hampshire tourism recession was defined as a period of declines in the year-over-year growth of real spending at lodgings.
Technical Notes
- Employment is the number of people employed from the household survey.
- The current values of rooms and meals revenues are estimated using the data obtained from participating local hoteliers.
- The data series reported in the dollar values are adjusted for inflation.
- Real Estate data is obtained from the Northern New England Real Estate Network (NNEREN). All analysis and commentary related to the statistics is that of the authors, and not that of NNEREN.
© Copyright 2010: Daniel Lee and Vedran Lelas, College of Business Administration, Plymouth State University.