Economy gains ground for both County and State.
In January, the Coos economy showed signs of stabilization. Improvement was seen across the sectors including manufacturing, hospitality and even the labor market. Manufacturing activities soared, as tracked by industrial electricity sales. Persistent increases in the coming months could be seen as revitalizing manufacturing industry. Hospitality industry remained strong as rooms and meals revenues continued its upward trend since hitting the lowest point in 2008. Even the labor market exhibited signs of relief as the number of people who have a job inched up for the month. On a year-over-year basis, losses in employment have slowed steadily in recent months, an indication that a turn toward adding jobs could be imminent. Real estate market did not fare as well, as home sales plunged.
Similar to the County economy, the State economy also exhibited signs of improvement. Manufacturing activities continued to rebound, as reflected in industrial electricity sales that turned up positive on a year-over-year basis for the first time in more than two years. The labor market experienced improvement. The number of people who have a job increased, and the estimated total compensation managed to edge up for the month. But, the data sent mixed signals for the hospitality industry; rooms and meals revenues continued to grow, while average Saturday traffic volume declined. Real Estate market struggled as home sales dropped.
Annual benchmark revision in household employment data and thus the revised Coincident Index shows that the forces of recovery in the State economy have not been as strong as previously reported. Household employment data has been revised nationwide after annual benchmarking activities. And rooms and meals data for the Coos County has been re estimated using the data from a new participant in the project, the BALSAMS along with other hotels in the county. As a result, past values of these variables and Coincident Index have been revised accordingly.
Coincident Index
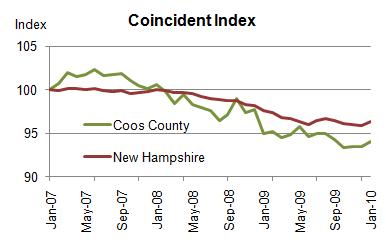

The Coos Coincident Index, which tracks the current state of the Coos economy, rose to 94.1 in January from December’s revised value of 93.5, for a gain of 0.7%. This gain was the second increase in the last three months. On a monthly year-over-year basis, the Index was down 0.9% from its January 2009 level. January’s monthly year-over-year loss was the 24th consecutive decline.

The New Hampshire Coincident Index rose to 96.3 in January from December’s revised value of 95.8 for a gain of 0.5%. This increase follows four consecutive months of decline. On a monthly year-over-year basis, the Index was down 1.3% from its January 2009 value. January’s monthly year-over-year loss was the 23rd consecutive decline.
How widespread is the change?
Month-to-Month Comparison
In January, four of the six indicators contributed to the increase in both Coos and NH Coincident index. While industrial electricity sales, employment, rooms and meals, and average Saturday traffic counts pushed the County Index higher, home sales and wages and salary disbursements fell from their December levels. At the state level, home sales and average Saturday traffic counts declined.
Year-Over-Year Comparison
In Coos County, only two of six indicators increased from their January 2009 levels. Industrial electricity sales, and rooms and meals showed positive growth. During the same time, three out of six indicators increased from January 2009 at the state level. Industrial electricity sales, home sales, and rooms and meals revenues exhibited positive growth.
Household Employment
Household employment measures the number of working-age adults who have jobs. In contrast to non-farm payroll employment that is more commonly used in the national and state indexes, household employment includes self-employed, unpaid domestic help and both farm and non-farm workers, all of which may be more significant in rural than urban economy. Employment tends to rise as economy grows.
 Coos County

Employment index, adjusted for seasonal variation, inched higher in January for the first time in the last six months, but is down from its January 2009 value. This year-over-year loss represents the 23rd consecutive decline.
New Hampshire
Employment at the state level, adjusted for seasonal variation, rose modestly in January for the first time in the last 22 months. But, it was still lower than its January 2009 level. Although this year-over-year decline represents the 17th consecutive loss, losses have steadily slowed in recent months.
Home Sales
It tracks the number of homes sold, which include both new and existing homes. Home transactions not only generate income for real estate brokers and mortgage bankers but also bring more businesses in other sectors including moving services, home furnishings and appliances. The latter is particularly true for new home sales. In interpreting percentage changes in the County’s home sales data, though, one should note that percentage changes can be highly volatile due to small sales volumes.
 Coos County
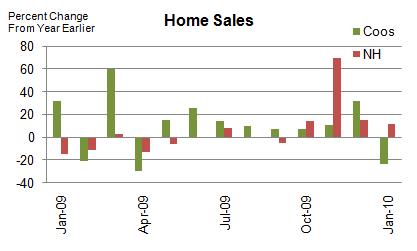
Home sales, adjusted for seasonal variation, took a nosedive in January offsetting December’s gain. Compared to its January 2009 level, it fell sharply. This year-over-year decline follows eight consecutive months of increase.
New Hampshire
Home sales, adjusted for seasonal variation, decreased in January for the second time in a row, but were still up from its January 2009 level. This year-over-year gain marks the fourth consecutive month of increase.
Room and Meals Revenues
It is estimated from total tax yielded from rooms and meals sales. It tends to increase with tourism activities.
 Coos County
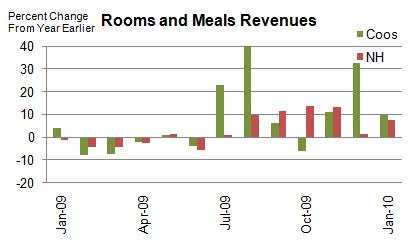
The estimated rooms and meals revenue, adjusted for seasonal variation and inflation, decreased after three consecutive months of increase. Compared to its January 2009 value, it was up modestly. This year-over-year gain was three months in a row.
New Hampshire
The estimated rooms and meals revenue, adjusted for seasonal variation and inflation, increased for the third time in the last four months, and was up from its January 2009 value. This year-over-year increase was for the seventh month in a row.
Traffic Counts
It tracks the average traffic counts on Saturdays each month. It is automatically recorded from traffic recorder located throughout the State. Two recorders are placed in the Coos county – Jefferson and Northumberland.
 Coos County

Average Saturday traffic counts, adjusted for seasonal variation, increased sharply for the second time in the last three months, but were down from its January 2009 level. This year-over-year loss marked the second decreases in a row.
New Hampshire
Average Saturday traffic counts, adjusted for seasonal variation, decreased for the third time in the last four months, and were down from its January 2009 level. This year-over-year loss was for the second time in the last three months.
Wages and Salaries
The estimated wage and salaries disbursements represent total compensation including pay for vacation, bonuses, stock options, and tips. This data is derived from all workers covered under state and federal unemployment insurance laws; but it excludes self-employed, domestic workers, and most agricultural workers. For its difference in the coverage, wages and salaries series complements household employment in monitoring the labor market conditions. A change in wages and salaries, adjusted for inflation, may reflect changes in the number of jobs, the ratio between part-time and full-time jobs, and wage rates.
 Coos County
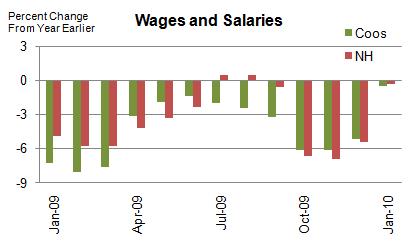
The estimated wages and salary disbursement, adjusted for seasonal variation and inflation, inched lower in January, for the seventh month in a row, and down from its January 2009 level. This year-over-year decline constitutes the 23 months of consecutive declines.
New Hampshire
The estimated wages and salary disbursement, adjusted for seasonal variation and inflation, advanced two months in a row, after four consecutive months of decline. Compared to its January 2009 level, it was down. This year-over-year loss was for the fifth consecutive month.
Industrial Electricity Sales
It measures sales of electricity (kWh) to industrial customers. Utilities categorize consumers into classes of service, which are used to determine their rates for electric service. The industrial sector includes manufacturing, construction, mining, agriculture, fishing, and forestry establishments. Among these industries, manufacturing is a primary industry in Coos County making up 69% (73% for New Hampshire in 2008) of the total number of jobs in the industries mentioned above according to the 2006 QCEW data. Therefore, a rise in industrial electricity sales may largely indicate invigorating manufacturing activities in the economy. But one should take caution in interpreting this indicator since its changes may also reflect changes in rates or reclassification of consumers between the industrial and commercial sectors.
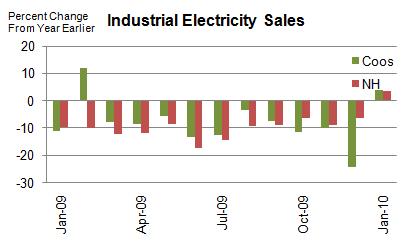
Coos County
Industrial electricity sales, adjusted for seasonal variation, soared in January, following four consecutive months of decline, and up from its January 2009 level. This year-over-year gain was the first increase in the past eleven months.
New Hampshire
At the state level, industrial electricity sales, adjusted for seasonal variation, rose sharply in January, for the third time in the last four months. More notably, it was up from its January 2009 level. This year-over-year gain is the first increase in more than two years.
Month-to-Month Comparison vs. Year-over-Year Comparison
Interpreting economic indicators may not be as easy as it might seem. This is particularly true when dealing with regional indicators that tend to be highly volatile. The month-to-month changes can be very volatile and may not represent true changes in economic conditions. To reduce the volatility and better detect the underlying trend in the economy, economists often use the year-over-year percent changes. However, this year-over-year percent comparison has a problem of its own. It doesn’t tell us anything about what happened between a year ago and the current period. It misses out the most recent changes in the economy. The recent changes should be reflected in the month-to-month percent changes. The bottom line is that one should be careful in interpreting economic indicators and should examine both the month-to-month changes and the year-over-year changes to get a good sense of what is happening in the economy. In addition, one should also apply the 3 Ds principle in interpreting economic indicators. With respect to this 3 Ds principle, refer to “How should economic index be interpreted?” on the About page.
Leading Indicators
This section is under construction. The future reports will include building permits, initial unemployment claims, new business formation, real estate indicators and possibly freight volumes.
Technical Notes
- The current values of rooms and meals revenues are estimated using the data obtained from participating local hoteliers.
- Employment is the number of people employed from the household survey.
- The quarterly wages and salary disbursements are smoothed into the monthly series after the current values are estimated using the Vector Error Correction Model.
- The data series reported in the dollar values are adjusted for inflation.
- The data series are adjusted for seasonal variation when identifiable seasonality is present.
- Real Estate data is obtained from the Northern New England Real Estate Network (NNEREN). All analysis and commentary related to the statistics is that of the authors, and not that of NNEREN.
© Copyright 2010: Daniel Lee and Vedran Lelas, College of Business Administration, Plymouth State University.