The Coös County economy continues to fall with no clear end in sight, while the State economy shows signs of stabilization.
Coincident Index
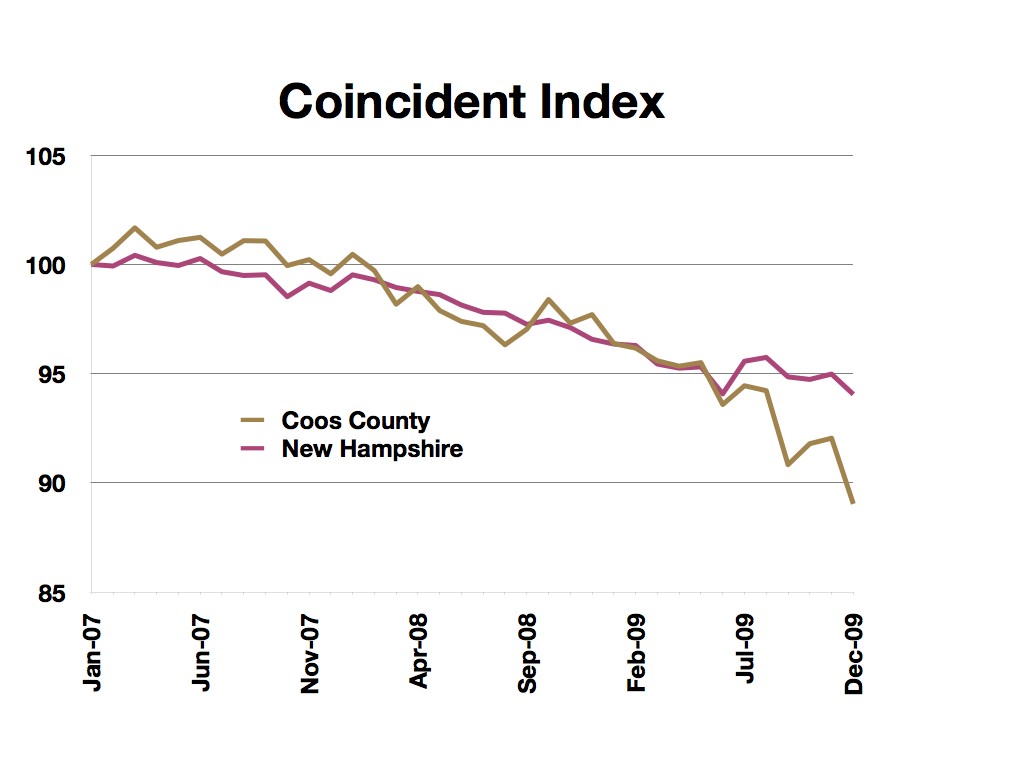

The New Hampshire Coincident Index fell to 94.1 in December from 95 in November for a loss of 1.0%. This decline was for the third time in the last six months. On a monthly year-over-year basis, the Index was down 2.6% from its December 2008 value. December’s decrease continues the downward trend that started back in 2007 when the current recession began.
Month-to-Month Comparison
In December, four of the six indicators contributed to the decrease in the Coös Coincident index. While home sales and rooms and meals revenue increased from their November levels, the index was dragged down by decreases in industrial electricity sales, employment, average Saturday traffic counts, and wages and salary disbursements.
 At the state level, three of the six component indicators contributed to the decrease in the New Hampshire Coincident Index. Employment, home sales, and rooms and meals revenue decreased sharply from their November levels, with more moderate increases experienced in industrial electricity sales, average Saturday traffic counts, and wages and salary disbursements.
Year-Over-Year Comparison
In December, five out of six indicators decreased from the December 2008 levels in Coös county. All indicators with the exception of home sales were down for the year. During the same time, only three out of six indicators decreased from December 2008 at the state level. Home sales, rooms and meals revenues, and average Saturday traffic counts managed to finish up for the year as the State economy stabilizes, while Industrial electricity sales, employment and wages and salary disbursements declined.
Industrial Electricity Sales

Coös County
Industrial electricity sales index, adjusted for seasonal variation, fell in December, for the fourth month in a row, and down sharply from the December 2008 level. This year-over-year decline was for the 10 months in a row.
New Hampshire
At the state level, the index, adjusted for seasonal variation, rose in December, for the fourth time in the last six months. However, the index was down from the December 2008 level and this year-over-year decline extends the pattern of the last two years.
Employment
Coös County
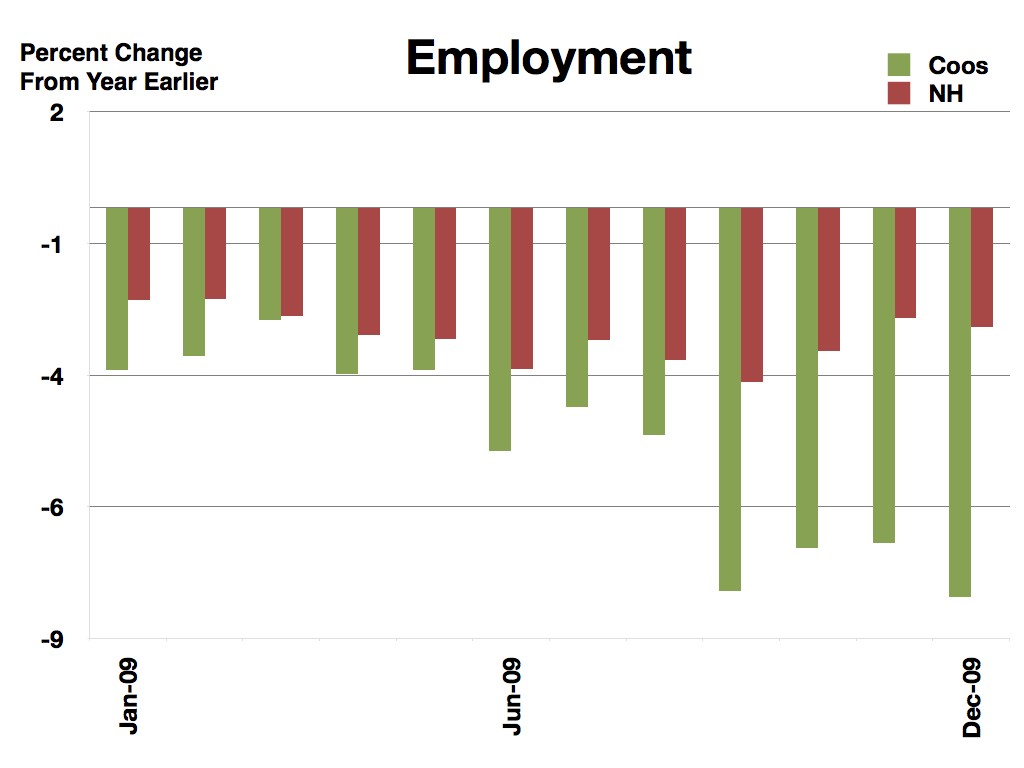
Employment index, adjusted for seasonal variation, fell in December, for the 4th time in the last five months, and is down considerably from the December 2008 value. This year-over-year loss represents the 22nd consecutive decline.
New Hampshire
Employment at the state level, adjusted for seasonal variation, fell in December, after two consecutive months of increase. Overall, it was down from the December 2008 value. This year-over-year decline represents the 18th consecutive loss.
Home Sales

Coös County
Home sales, adjusted for seasonal variation, rebounded sharply in December after three consecutive months of decline, and were up from the December 2008 level. This year-over-year gain marks the 8th consecutive month of increase.
New Hampshire
Home sales, adjusted for seasonal variation, fell sharply in December after two consecutive months of equally strong increase, but were up from the December 2008 level. This year-over-year gain marks the 3rd consecutive month of increase.
Rooms and Meals Revenues

Coös County
Rooms and meals revenue, adjusted for seasonal variation and inflation, decreased sharply after two consecutive months of increase, which was down significantly from the December 2008 value. This year-over-year decline was for the 2nd time in the last five months.
New Hampshire
Rooms and meals revenue, adjusted for seasonal variation and inflation, decreased sharply for only the second time in the last six months, but was up from the December 2008 value. This year-over-year increase was for the 6th month in a row.
Traffic Counts
Coös County
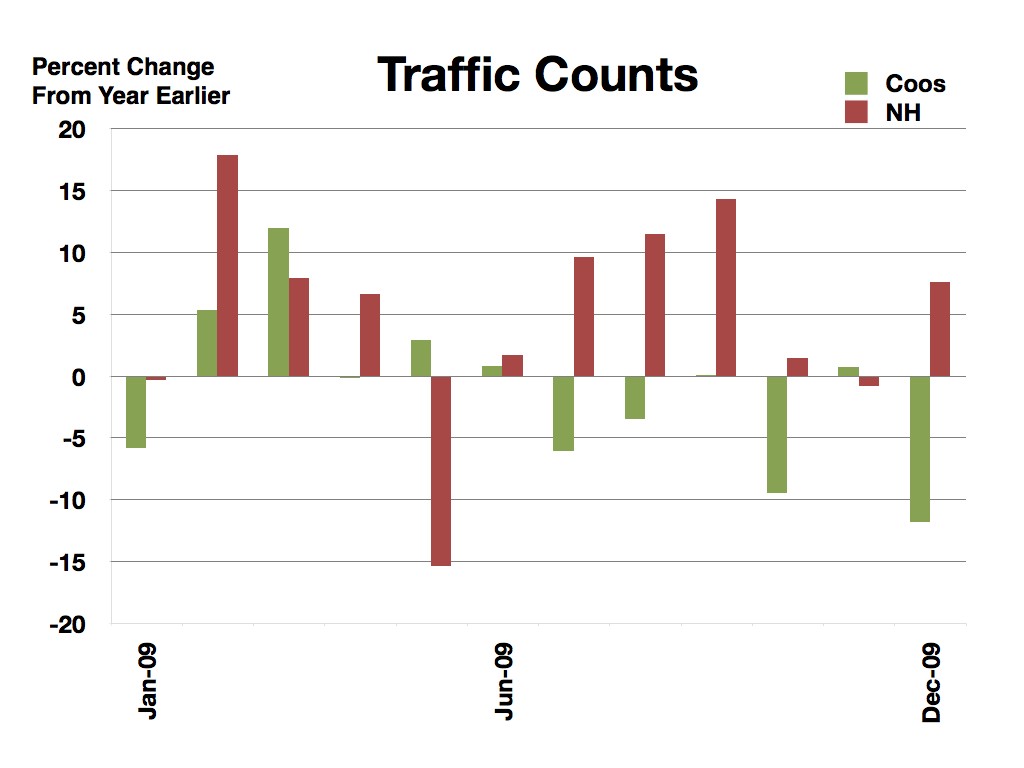
Average Saturday traffic counts, adjusted for seasonal variation, decreased for the 2nd time in the last four months, down sharply from the December 2008 level. This year-over-year decline was for the 2nd time in the last four months.
New Hampshire
Average Saturday traffic counts, adjusted for seasonal variation, increased for the 4th time in the last six months, up from the December 2008 level. This year-over-year increase was for the 6th time in the last seven months.
Wages and Salaries

Coös County
Wages and salary disbursement, adjusted for seasonal variation and inflation, fell in December, for the 3rd month in a row, sharply down from the December 2008 level. This year-over-year decline constitutes the 22 months of consecutive declines.
New Hampshire
Wages and salary disbursement, adjusted for seasonal variation and inflation, increased in December, after four consecutive months of decline, down from the December 2008 level. This year-over-year drop represents the 4th consecutive month of decline.
Summary
Coös County
In summary, there is little good news about the County economy today. Manufacturing activities, tracked by industrial electricity consumption, continued to decline. Labor markets remained weak. Retail and hospitality industries fare not as badly, since the average Saturday traffic counts and rooms and meals revenues recently reported some increases, although sparingly. If these monthly increases become persistent with stronger signals, this will be the first sign of economic recovery. Real Estate sector clearly showed signs of rejuvenation thanks to tax credits to first-time home buyers.
New Hampshire
Compared to the Coös economy, the State economy showed the stronger signs of recovery. Manufacturing activities, tracked by industrial electricity consumption, seemed to have hit the bottom. Labor markets remained weak, but its pace of decline has slowed in recent months. Retail and hospitality industries have been back on the growth path since the average Saturday traffic counts and rooms and meals revenues have shown persistent increases in recent months. Real Estate industry continued an upward trend on a year-over-year basis despite a sharp decline in December from November in home sales.
Month-to-Month Comparison vs. Year-over-Year Comparison
Interpreting economic indicators may not be as easy as it might seem. This is particularly true when dealing with regional indicators that tend to be highly volatile. The month-to-month changes can be very volatile and may not represent true changes in economic conditions. To reduce the volatility and better detect the underlying trend in the economy, economists often use the year-over-year percent changes. However, this year-over-year percent comparison has a problem of its own. It doesn’t tell us anything about what happened between a year ago and the current period. It misses out the most recent changes in the economy. The recent changes should be reflected in the month-to-month percent changes. The bottom line is that one should be careful in interpreting economic indicators and should examine both the month-to-month changes and the year-over-year changes to get a good sense of what is happening in the economy. In addition, one should also apply the 3 Ds principle in interpreting economic indicators. With respect to this 3 Ds principle, refer to “How should economic index be interpreted?” on the About page.
Leading Indicators
This section is under construction. The future reports will include building permits, initial unemployment claims, new business formation, real estate indicators and possibly freight volumes.
Technical Notes
- The current values of rooms and meals revenues are estimated using the data obtained from participating local hoteliers.
- Employment is the number of people employed from the household survey.
- The quarterly wages and salary disbursements are smoothed into the monthly series after the current values are estimated using the Vector Error Correction Model.
- The data series reported in the dollar values are adjusted for inflation.
- The data series are adjusted for seasonal variation when identifiable seasonality is present.
- Real Estate data is obtained from the Northern New England Real Estate Network (NNEREN). All analysis and commentary related to the statistics is that of the authors, and not that of NNEREN.
© Copyright 2010: Daniel Lee and Vedran Lelas, College of Business Administration, Plymouth State University.