State economy losing steam
[innerindex]I’d like to make a brief announcement about an upcoming change in the North Country Economic Index (NCEI) project. In an attempt to better cover the region’s economy and contribute to its revitalization, a new section will be added to the NCEI. This new section will be written by a student, who will report stories and episodes happening in the region. Occasionally, the student will introduce best practices in rural economic development in other parts of the country as well. In order to better coordinate this student effort, we decided to move the report to quarterly from monthly. With this change, the NCEI will be released four times a year – in March for Winter (December, January and February), in June for Spring (March, April and May), in September for Summer (June, July and August), and in December for Autumn (September, October and November). The first issue of the new look NCEI will be out in September. There won’t be another report until then.
In April, the Coos Index fell for the 12th consecutive month on a monthly year-over-year basis. The percentage decline was the largest since 2009, and the pace of the decline was accelerating. All five indicators fell on a monthly year-over-year basis. The declines in some of the indicators may be attributed to the temporary closure of BALSAMS. Although the decline of the economic activity in the County had been observed even before the Resort’s closure, it certainly made it worse. The unusually warm weather and the premature ending of the ski season did not help the tourism industry either. Estimated rooms and meals revenues fell three months in a row on a monthly year-over-year basis; and average Saturday traffic counts declined 14 consecutive months.
In April, the State economy continued to grow for nearly two years. But there were increasing signs that the state economy might be losing steam. Although still growing on a monthly year-over-year basis, on a month-to-month basis did the growth of the Index come to a halt after steady declines since past December. Three of five component indicators fell below from a year ago. This is consistent with other economic data. The New Hampshire Employment Security reported that the number of jobs fell in April compared to a year ago; and the job losses are broad based across all but a few industries. In addition, the Philadelphia Federal Reserve Bank showed in its state coincident indicators that the economic growth had been slowing in New Hampshire since February 2011, while the growth of the national economy had picked up the pace during the same period. It also showed that New Hampshire’s economy didn’t grow as fast as some of its neighbors in New England for the past three months – Vermont, Massachusetts and Connecticut. Does this mean that New Hampshire is leading the nation to double dip recession or following the nation to recovery? It’ll be interesting to find it out.
The real estate market analysis can be found at the end of this report.
Coincident Index

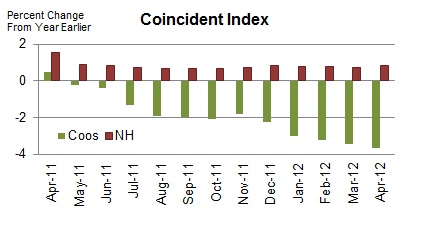
The Coos Coincident Index, which tracks the current state of the Coos economy, fell to 89.0 in April from March’s revised value of 89.5. On a monthly year-over-year basis, the Index declined for the 12th month in a row.

The New Hampshire Coincident Index ticked up to 96.5 in April from March’s revised value of 96.4. The index remained up from a year ago.
How strong are the forces of change?
In April, the Coos Coincident Index fell for the 12th month in a row on a monthly year-over-year basis. All five component indicators remained down from their April 2011 levels. The pace of decline was the largest in two years and kept increasing. The State Index increased 19 months in a row on a monthly year-over-year basis. However, only two of five component indicators remained up from prior year. The month-to-month growth rate nearly came to a halt after steadily declining since past December.
Household Employment
Household employment measures the number of employed residents. In contrast to non-farm payroll employment that is more commonly used in the national and state indexes, household employment includes self-employed, unpaid domestic help and both farm and non-farm workers, all of which may be more significant in rural than urban economy. Employment tends to rise as economy grows.
 Coos County

Employment index, adjusted for seasonal variation, contracted after expanding two straight months. On a monthly year-over-year basis, it continued its long-term skid.
New Hampshire
Employment at the state level, adjusted for seasonal variation, was little changed. Still, it remained up from a year ago.
Rooms and Meals Revenues
It is estimated from total tax yielded from rooms and meals sales. It tends to increase with tourism activities.
Coos County

The estimated rooms and meals revenue, adjusted for inflation and smoothed by 12 month moving average, fell for the fifth consecutive month. On a monthly year-over-year basis, it fell three months in a row.
New Hampshire
The estimated rooms and meals revenue, adjusted for inflation and smoothed by 12 month moving average, fell for the first time since August 2011. It also declined below from where it was a year ago.
Traffic Counts
It tracks the average vehicle traffic counts on Saturdays each month, which is automatically collected from traffic recorders located throughout the State. Two recorders are placed in the Coos county – Jefferson and Northumberland.
 Coos County

Average Saturday traffic counts, smoothed by 12 month moving average, little changed. On a monthly year-over-year basis, it dropped 14 straight months.
New Hampshire
Average Saturday traffic counts, smoothed by 12 month moving average, rose after falling three straight months. On a monthly year-over-year basis, it decreased for the 10th month in a row.
Wages and Salaries
The estimated wage and salaries disbursements represent total compensation including pay for vacation, bonuses, stock options, and tips. This data is obtained from all workers covered under state and federal unemployment insurance laws; in other words, it is full population counts, not sample-based estimates. Unlike the household employment report, however, it excludes self-employed, domestic workers, and most agricultural workers. For this difference, wages and salaries series complements the number of employed residents in monitoring the labor market conditions as well as the economy. A change in wages and salaries, adjusted for inflation, may reflect changes in the number of jobs, the ratio between part-time and full-time jobs, and wage rates.
Coos County

The estimated wages and salary disbursement, adjusted for inflation and smoothed by 12 month moving average, increased from March. And, it was up from where it stood a year ago.
New Hampshire
The estimated wages and salary disbursement, adjusted for inflation and smoothed by 12 month moving average, increased from February. And, it was up from where it stood a year ago.
Industrial Electricity Sales
It measures sales of electricity (kWh) to industrial customers. Utilities categorize consumers based on the North American Industry Classification System, demand, or usages. The industrial sector includes manufacturing, construction, mining, agriculture, fishing, and forestry establishments. Among these industries, manufacturing is a primary industry in Coos County making up 69% (73% for New Hampshire in 2008) of the total number of jobs in the industrial sector mentioned above according to the 2006 QCEW data. Therefore, a rise in industrial electricity sales may largely indicate invigorating manufacturing activities in the economy.
 Coos County
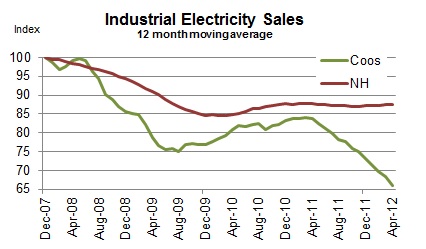
Industrial electricity sales, smoothed by 12 month moving average, fell for the 13th consecutive month. On a monthly year-over-year basis, it fell for the 11th consecutive month.
New Hampshire
Industrial electricity sales, smoothed by 12 month moving average, little changed. Still, it fell seven months in a row on a monthly year-over-year basis.
Real Estate
NCEI reports two real estate market indicators – home sales and median home prices. The data tracks residential homes sold, including condos and manufactured homes. The health of the real estate sector is important to the broad economy due to its multiplier effect. Home transactions not only generate income for real estate brokers and mortgage bankers but also bring more businesses in other sectors including moving services, home furnishings and appliances. In order to minimize volatility in Coos real estate market, indicators are averaged over a 12 month period.
Coos County
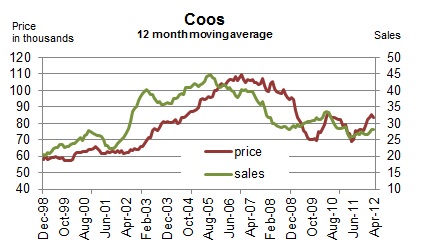
In April, the Coos housing market continued its fledgling recovery. Home sales, smoothed by 12-month moving average, rose two months in a row on a monthly year-over-year basis. Median home prices, smoothed by 12-month moving average, rose four straight months on a monthly year-over-year basis.
 New Hampshire
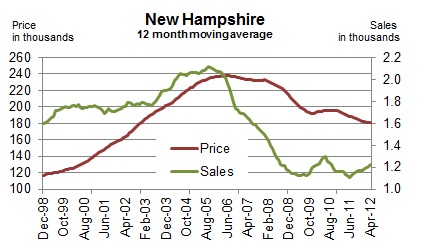
The National Association of Realtors (NAR) reported that recovery is underway for the nation’s battered housing market. Both sales and prices picked up in April. NAR added that the recovery is broad based across all regions. This was only half true for New Hampshire where sales were up but prices continued to fall in April. Home sales, smoothed by 12-month moving average, rose six months in a row at an increasing pace on a monthly year-over-year basis. Median home prices, smoothed by 12-month moving average, continued to fall.
Leading Indicators
This section is under construction. The future reports will include building permits, initial unemployment claims, new business formation, real estate indicators and possibly freight volumes.
Technical Notes
- Employment is the number of people employed from the household survey.
- The current values of rooms and meals revenues are estimated using the data obtained from participating local hoteliers.
- The quarterly wages and salary disbursements are smoothed into the monthly series after the current values are estimated.
- These models to estimate the current values of rooms and meals revenues and wages and salary disbursements are re estimated once a year in February using updated data.
- The data series reported in the dollar values are adjusted for inflation.
- Seasonal factors for the number of employed residents are recalculated once a year in February using updated data. Thus, the seasonally adjusted data series are to be revised accordingly.
- Real Estate data is obtained from the Northern New England Real Estate Network (NNEREN). All analysis and commentary related to the statistics is that of the authors, and not that of NNEREN.
© Copyright 2010: Daniel Lee and Vedran Lelas, College of Business Administration, Plymouth State University.