Manufacturing a drag on recovery
[innerindex]In October, the Coos Index fell for the fifth month in a row on a monthly year-over-year basis. Three out of four available component indicators were down from prior year (October report for Saturday traffic counts has not been released yet). Estimated rooms and meals revenues series was the only indicator that was up from a year ago, indicative of a strong hospitality industry. However, stagnant Saturday traffic counts suggests otherwise. The mixed picture demonstrates that fewer tourists brought in more revenues and that there has been a shift to high end market in the region’s hospitality industry. It may also suggest struggling smaller players, which cater to low to middle income tourists. The County’s other indicators continued on the downward trend. In particular, industrial electricity sales saw a steep decline, indicative of the struggling manufacturing sector. The labor market showed no signs of improvement; both number of employed residents and estimated wages and salaries kept on falling on a year-over-year basis. The Index was computed assuming no change in Saturday vehicle traffic counts from September.
The State economy fared better. Its monthly year-over-year growth rate increased for the first time since March. Three of four available indicators were up from prior year. The labor market showed signs of improvement; the monthly year-over-year growth rate of number of employed residents rose two months in a row after falling four straight months. The hospitality industry seemed to have done better as well; estimated rooms and meals revenues remained up from a year earlier. However, the manufacturing sector contracted; the monthly year-over-year growth of industrial electricity sales fell for the first time since the end of the latest recession. The weakening manufacturing sector became a drag on the economy.
The real estate market analysis can be found at the end of this report.
Coincident Index
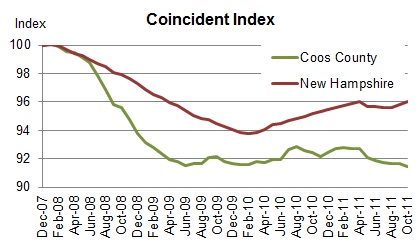
 The Coos Coincident Index, which tracks the current state of the Coos economy, edged down to 91.4 from September’s revised value of 91.6. On a monthly year-over-year basis, the Index declined for the fifth month in a row.
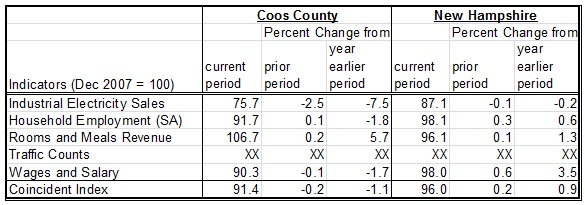
The New Hampshire Coincident Index ticked up to 96 in October from September’s revised value of 95.8. On a monthly year-over-year basis, the Index increased its pace of growth for the first time since March.
How strong are the forces of change?
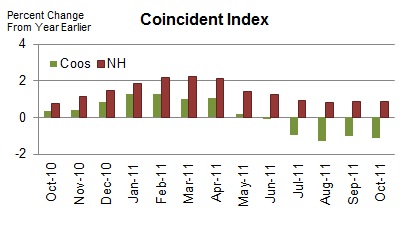
In October, the Coos Coincident Index fell for the fifth month in a row on a monthly year-over-year basis. Three out of four component indicators were down from their October 2010 levels. The State Index increased 14 months in a row on a monthly year-over-year basis. Three out of four component indicators remained up from prior year. Its monthly year-over-year growth picked up pace for the first time since March.
Household Employment
Household employment measures the number of employed residents. In contrast to non-farm payroll employment that is more commonly used in the national and state indexes, household employment includes self-employed, unpaid domestic help and both farm and non-farm workers, all of which may be more significant in rural than urban economy. Employment tends to rise as economy grows.
 Coos County

Employment index, adjusted for seasonal variation, expanded for the third time in four months. On a monthly year-over-year basis, it continued its long-term skid.
New Hampshire
Employment at the state level, adjusted for seasonal variation, advanced two months in a row after contracting four straight months. On a monthly year-over-year basis, its growth rate picked up pace for the second month in a row.
Rooms and Meals Revenues
It is estimated from total tax yielded from rooms and meals sales. It tends to increase with tourism activities.
Coos County

The estimated rooms and meals revenue, adjusted for inflation and smoothed by 12 month moving average, rebounded after falling two straight months. On a monthly year-over-year basis, its growth rate steadily declined for the fourth month in a row.
New Hampshire
The estimated rooms and meals revenue, adjusted for inflation and smoothed by 12 month moving average, rose for the fourth time in five months. And it remained up from prior year.
Traffic Counts
It tracks the average vehicle traffic counts on Saturdays each month, which is automatically collected from traffic recorders located throughout the State. Two recorders are placed in the Coos county – Jefferson and Northumberland.
October data has yet to be released by the NH Department of Transportation.
Wages and Salaries
The estimated wage and salaries disbursements represent total compensation including pay for vacation, bonuses, stock options, and tips. This data is obtained from all workers covered under state and federal unemployment insurance laws; in other words, it is full population counts, not sample-based estimates. Unlike the household employment report, however, it excludes self-employed, domestic workers, and most agricultural workers. For this difference, wages and salaries series complements the number of employed residents in monitoring the labor market conditions as well as the economy. A change in wages and salaries, adjusted for inflation, may reflect changes in the number of jobs, the ratio between part-time and full-time jobs, and wage rates.
Coos County

The estimated wages and salary disbursement, adjusted for inflation and smoothed by 12 month moving average, dropped from prior month. And, it remained down from a year earlier.
New Hampshire
The estimated wages and salary disbursement, adjusted for inflation and smoothed by 12 month moving average, increased from September. And, it was up from where it stood a year ago.
Industrial Electricity Sales
It measures sales of electricity (kWh) to industrial customers. Utilities categorize consumers based on the North American Industry Classification System, demand, or usages. The industrial sector includes manufacturing, construction, mining, agriculture, fishing, and forestry establishments. Among these industries, manufacturing is a primary industry in Coos County making up 69% (73% for New Hampshire in 2008) of the total number of jobs in the industrial sector mentioned above according to the 2006 QCEW data. Therefore, a rise in industrial electricity sales may largely indicate invigorating manufacturing activities in the economy.
 Coos County

Industrial electricity sales, smoothed by 12 month moving average, fell for the seventh consecutive month. On a monthly year-over-year basis, it retreated five months in a row.
New Hampshire
Industrial electricity sales, smoothed by 12 month moving average, dropped for the third time in four month. On a monthly year-over-year basis, it fell for the first time since the end of the latest recession.
Real Estate
NCEI reports two real estate market indicators – home sales and median home prices. The data tracks residential homes sold, including condos and manufactured homes. The health of the real estate sector is important to the broad economy due to its multiplier effect. Home transactions not only generate income for real estate brokers and mortgage bankers but also bring more businesses in other sectors including moving services, home furnishings and appliances. In order to minimize volatility in Coos real estate market, indicators are averaged over a 12 month period.
Coos County

In October, both home sales and prices fell but at decreasing rates. Home sales, smoothed by 12-month moving average, contracted for the 14th consecutive month on a monthly year-over-year basis; but its pace of decline decreased five straight months. Median home prices, smoothed by 12-month moving average, fell for the eighth straight month on a monthly year-over-year basis; but its pace of decline decreased for the fourth month in a row.
 New Hampshire

In State’s housing market, there was no sign of slowing down in falling home prices. Home sales, smoothed by 12-month moving average, contracted for the 12th consecutive month; but its pace of decline slowed for the fourth straight month. Median home prices, smoothed by 12-month moving average, slid nine months in a row at an increasingly faster pace.
Leading Indicators
This section is under construction. The future reports will include building permits, initial unemployment claims, new business formation, real estate indicators and possibly freight volumes.
Technical Notes
- Employment is the number of people employed from the household survey.
- The current values of rooms and meals revenues are estimated using the data obtained from participating local hoteliers.
- The quarterly wages and salary disbursements are smoothed into the monthly series after the current values are estimated.
- These models to estimate the current values of rooms and meals revenues and wages and salary disbursements are re estimated once a year in February using updated data.
- The data series reported in the dollar values are adjusted for inflation.
- Seasonal factors for the number of employed residents are recalculated once a year in February using updated data. Thus, the seasonally adjusted data series are to be revised accordingly.
- Real Estate data is obtained from the Northern New England Real Estate Network (NNEREN). All analysis and commentary related to the statistics is that of the authors, and not that of NNEREN.
© Copyright 2010: Daniel Lee and Vedran Lelas, College of Business Administration, Plymouth State University.