Bad Weather, Tourism, and the North Country
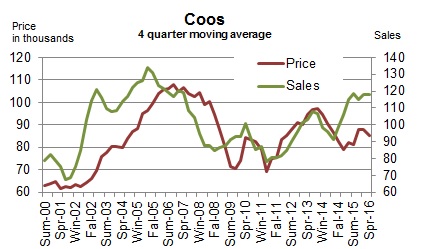
The past winter’s unfavorable weather continued to weigh on the County’s tourism industry during Spring 2016. As a result, the County’s overall economy struggled: the Coos Index ticked down 0.1% from Winter 2016. The tourism industry’s strong growth came to a halt as the region’s winter sports and outdoor recreational activity plummeted due to the bad weather. The rooms and meals tax fell from the prior quarter for the first time in two years. The goods-producing sector failed to build a momentum: the industrial electricity sales fell on a year-over-year basis after increasing in Winter 2016 for the first time in nearly two years. On a positive note, the County’s housing market remained strong; the volume of home sales grew for the sixth quarter in a row on a year-over-year basis, and its median home price increased three straight quarters.
The state’s economic growth accelerated. The State Index increased for the 23rd straight quarter on a year-over-year basis. The pace of growth accelerated for the fifth quarter in a row. Four out of the five component indicators were up compared to the same period in 2015. The accelerating economic growth was most evident in the scorching labor market. The employment indicator of the State Index grew at the fastest pace since the beginning of the Great Recession. The U.S. BLS data confirms this: the seasonally adjusted number of employed residents was at the highest in May 2016 since at least 1974 when its current data started. Not only that, the pace of the increases had accelerated since the beginning of this year. The number of jobs is also at the record high: the U.S. BLS reports that the state had 661,000 jobs in May 2016, which is the highest monthly record ever. The tourism industry remained strong, although its counterpart in the northern regions suffered from the bad weather. The average Saturday vehicle traffic counts increased by 4.0% on a year-over-year basis, while the inflation-adjusted rooms and meals tax increased by 7.4%. However, the manufacturing industry continued to struggle: industrial electricity sales fell six straight quarters on a year-over-year basis. The unfavorable global environment continued to be an obstacle to the industry’s international exports. The state’s economy will likely stay strong in the near future: three of four state leading indicators were up compared to six months ago in their year-over-year growth rate. The state’s housing market remained strong; the volume of home sales increased six straight quarters at an increasingly fast pace on a year-over-year basis and median home prices rose 14 straight quarters.
Coincident Index
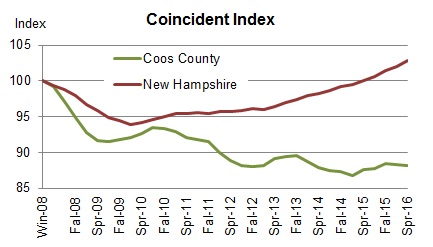
The Coos Coincident Index, which tracks the current state of the Coos economy, inched down to 88.2 in Spring 2016 from Winter 2015’s revised value of 88.3. On a quarterly year-over-year basis, the Index increased four consecutive quarters.
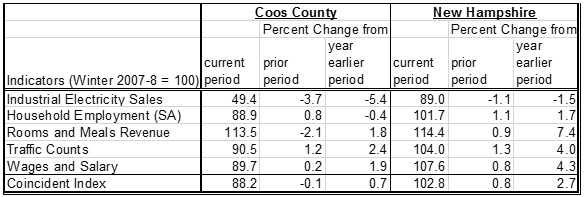
The New Hampshire Coincident Index rose to 102.8 in Spring 2016 from Winter 2015’s revised value of 102.0. On a quarterly year-over-year basis, the Index increased for the 23rd consecutive quarter.
How strong are the forces of change?
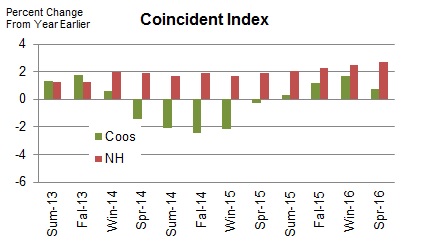
During Spring 2016, the Coos Coincident Index increased for the fourth straight quarter after decreasing five consecutive quarters on a quarterly year-over-year basis. However, the pace of increases decelerated for the first time in a year. Three of the five component indicators remained up from their Spring 2015 levels. The State Index increased for the 23rd quarter in a row on a quarterly year-over-year basis. Four out of the five component indicators remained up from a year ago. The pace of growth accelerated five straight quarters.
Household Employment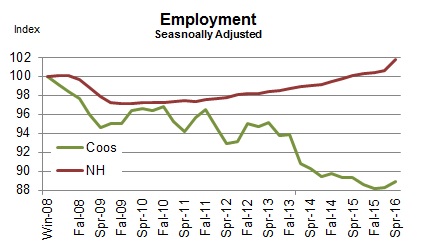
Household employment measures the number of employed residents. In contrast to non-farm payroll employment that is more commonly used in the national and state indexes, household employment includes self-employed, unpaid domestic help and both farm and non-farm workers, all of which may be more significant in rural than urban economy. Employment tends to rise as economy grows.
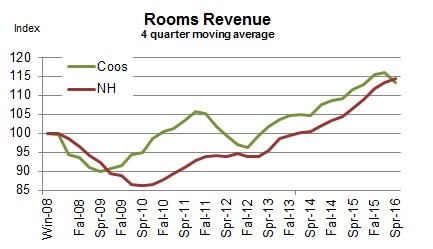 Rooms Revenue
Rooms revenue represents spending on accommodations paid by travelers. It’s an important indicator for the tourism sector; it’s not an estimate but an official count as reported by the New Hampshire Department of Revenue Administration. However, it may not fully reflect changes in the overall activity level in the tourism sector. Although it tracks a majority of overnight travelers, it excludes day travelers and overnight travelers staying with friends and family and those who have second homes. However, this drawback may be less of a concern in the northern regions of the state where day travelers are a small minority due to the distance from the major urban areas.
Traffic Counts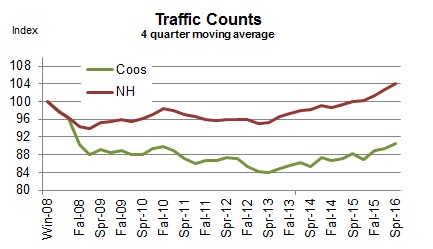
It tracks the average vehicle traffic counts on Saturdays each quarter, which is automatically collected from traffic recorders located throughout the State. 12 recorders are selected to reflect traveler traffic in each of the seven travel regions in the State with two recorders from Coos County – Jefferson and Northumberland.
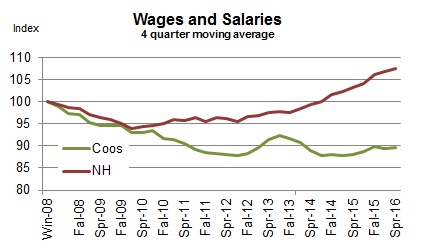 Wages and Salaries
The estimated wage and salaries disbursements represent total compensation including pay for vacation, bonuses, stock options, and tips. This data is obtained from all workers covered under state and federal unemployment insurance laws; in other words, it is full population counts, not sample-based estimates. Unlike the household employment report, however, it excludes self-employed, domestic workers, and most agricultural workers. For this difference, wages and salaries series complements the number of employed residents in monitoring the labor market conditions as well as the economy. A change in wages and salaries, adjusted for inflation, may reflect changes in the number of jobs, the ratio between part-time and full-time jobs, and wage rates.
Industrial Electricity Sales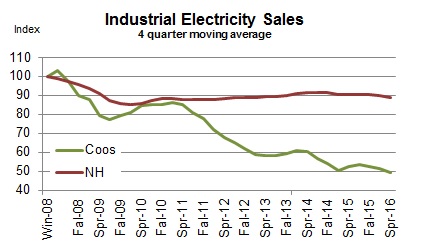
It measures sales of electricity (kWh) to industrial customers. Utilities categorize consumers based on the North American Industry Classification System, demand, or usages. The industrial sector includes manufacturing, construction, mining, agriculture, fishing, and forestry establishments. Among these industries, manufacturing is a primary industry in Coos County making up 69% (73% for New Hampshire in 2008) of the total number of jobs in the industrial sector mentioned above according to the 2006 QCEW data. Therefore, a rise in industrial electricity sales may largely indicate invigorating manufacturing activities in the economy.
Real Estate
NCEI reports two real estate market indicators – home sales and median home prices. The data tracks residential homes sold, including condos and manufactured homes. The health of the real estate sector is important to the broad economy due to its multiplier effect. Home transactions not only generate income for real estate brokers and mortgage bankers but also bring more businesses in other sectors including moving services, home furnishings and appliances. In order to minimize volatility in Coos real estate market, indicators are averaged over a four quarter period.
 Coos County
The County’s housing market remained strong during Spring 2016. The volume of home sales, smoothed by four quarter moving average, rose six straight quarters on a year-over-year basis. The median home price, smoothed by four quarter moving average, increased for the third consecutive quarter.
New Hampshire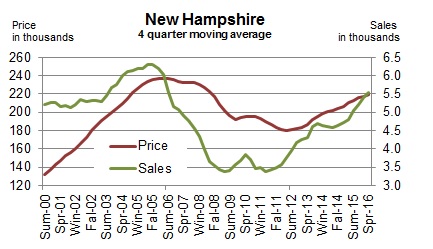
The state’s housing market stayed hot. The volume of home sales, smoothed by the four-quarter moving average, grew six quarters in a row at an increasingly faster pace on a year-over-year basis. The median home price, smoothed by four quarter moving average, increased for the 14th consecutive quarter.
Leading Indicators
Leading indicators are to provide a sense of future economic conditions in the state of New Hampshire. The report includes six leading indicators grouped into three different categories – 1) four leading indicators for the broad economy of New Hampshire; 2) a leading indicator of the state’s tourism industry; 3) a leading indicator of the U.S. economy. The list of leading indicators for New Hampshire’s economy includes initial unemployment claims, average weekly hours of work in the total private sector, building permits, and new business formation; the state’s tourism industry has the Massachusetts Leading Index published by the Philadelphia Federal Reserve Bank; the report also includes interest rate spread between 10-year Treasury and federal funds for the U.S. economy. Although the list is by no means exhaustive and indicators often do not go back long enough in time for statistically robust analysis, we believe it can still be a helpful tool. Raw data are processed so as to make it easier to detect a change in the direction of the underlying trend in the economy. In the summary table below, “up” during recession indicates recovery around the corner while “down” during an expansion signals an impending recession. During expansion, the likelihood of recession increases when more indicators turn down persistently. For example, all four leading indicators of NH economy start posting “down” month after month at the beginning of the state’s 2008 recession. The New Hampshire recessions are defined as the period of declines in the New Hampshire Coincident Index published by the Philadelphia Federal Reserve Bank.
In May 2016, three of the four New Hampshire leading indicators were up compared to six months ago in their year-over-year growth rate.
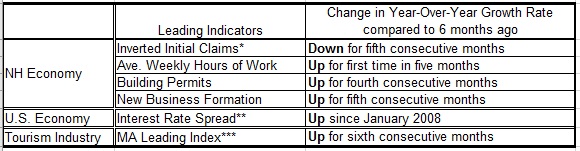
*This series is inverted so that an “up” means an improvement. Layoffs decrease (inverted layoff increases) when the labor market conditions improve.
**”Up” or “down” is a change in the spread from prior month.
***”Up” or “down” is a change in the Index from six month ago.
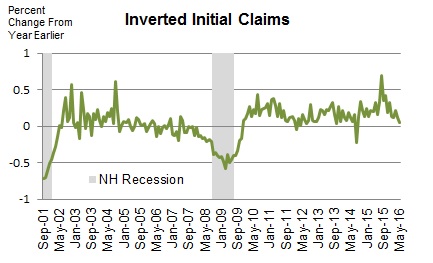 Initial Unemployment Claims
The series is inverted so that an increase means an improvement. Initial claims decrease (inverted initial claims increase) when the labor market condition improves. The number of Initial claims tends to lead the business cycle. The chart demonstrates that it correctly predicted both the beginning and the ending of the past two recessions.
Average Weekly Hours of Work in Private Sector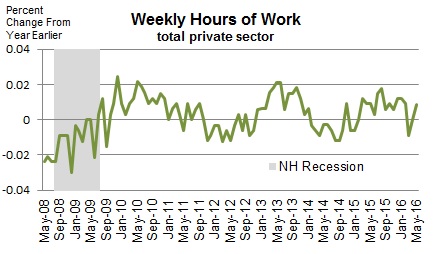
It tends to turn before the economy does because employers often increase work hours of existing workers at the beginning of the recovery before committing to new hires; they do not want to take the risk of committing to new hires and seeing the economy fall back again. This data for New Hampshire only goes back to 2007.
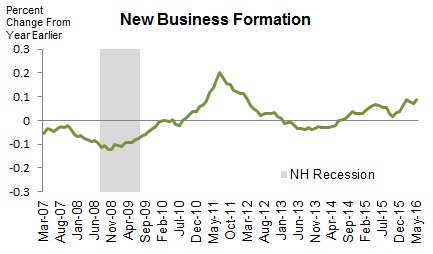 New Business Formation
All companies that want to do business in the state must register at the NH Secretary of State. This data includes all types of businesses including corporations and limited liabilities companies. The number of new businesses tends to lead the business cycle. Although this series goes back only to 2006, it correctly predicted the beginning and ending of the state’s 2008 recession. The series is smoothed by 12 month moving average.
Building Permits for Single Family Homes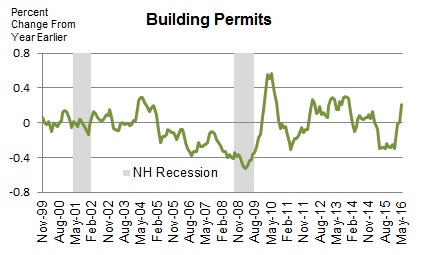
It’s often the case housing recovery leads the broad economy out of recession. This is because of its extensive ripple effect over the rest of the economy. Building construction requires inputs from many other industries such as window manufacturing, logging, plumbing, electricity services, banking, and home furnishings such as consumer electronics and furniture. The 2001 recession was a mild recession and a rare one that did not involve a housing slump. The series is smoothed by four month moving average.
Interest Rate Spread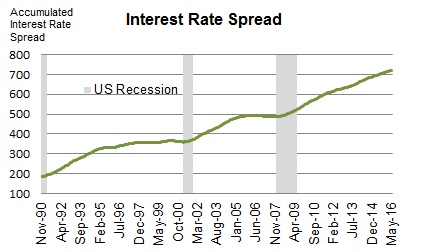
The interest rate spread, the 10 year Treasury less the Federal Funds, is considered one of the best leading indicators for the national economy. The indicator is the sum of all the past values plus the spread in the current period. Therefore, it decreases when the current spread is negative (the 10 year T rate is lower than the Fed Funds Rate), which is indicative of an impending recession.
Massachusetts Leading Index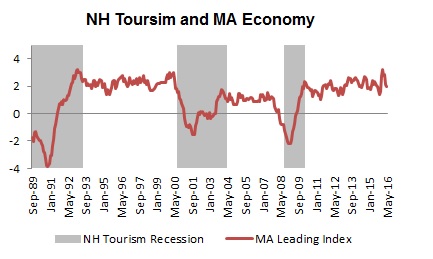
The state of Massachusetts economy is critical for the New Hampshire’s tourism industry, since the largest share of visitors to New Hampshire come from Massachusetts. Therefore, the Massachusetts Leading Index may also shed light on the future performance of the New Hampshire’s tourism industry. The MA Leading Index is published by the Philadelphia Federal Reserve Bank. A New Hampshire tourism recession was defined as a period of declines in the year-over-year growth of real spending at lodgings.
Technical Notes
- Employment is the number of people employed from the household survey.
- The current values of rooms and meals revenues are estimated using the data obtained from participating local hoteliers.
- The data series reported in the dollar values are adjusted for inflation.
- Real Estate data is obtained from the Northern New England Real Estate Network (NNEREN). All analysis and commentary related to the statistics is that of the authors, and not that of NNEREN.
© Copyright 2010: Daniel Lee and Vedran Lelas, College of Business Administration, Plymouth State University.