Economic Recovery Losing Steam?
[innerindex]In Winter 2013, the Coos Index fell for the eighth quarter in a row on a quarterly year-over-year basis. All five component indicators were down from a year ago. On a positive note, the pace of declines slowed for the first time in a year. The hospitality sector, which had been on a downward trend in the wake of the closure of the BALSAMS, may have bottomed out. Spending on accommodations by travelers was up from the prior quarter for the first time since summer 2011. Economic activity declined in the goods-producing sector; industrial electricity sales continued to fall by a double-digit figure. The labor market indicators, which measure the performance of the broader economy, continued to struggle; both number of employed residents and estimated wages and salaries declined on a quarterly year-over-year basis.
In Winter 2013, the State’s economic recovery remained sluggish. The revised State Index inched down for the first time on a quarterly year-over-year basis since the Great Recession ended. Three of the five component indicators turned down compared to a year ago. The hospitality sector struggled; both spending on accommodations by travelers and average Saturday traffic counts were down from a year ago. The signs of the sluggish labor market had become clearer every quarter; the growth of the number of employed residents nearly came to a halt after four consecutive quarters of steady declines, while estimated wages and salaries already started declining. On positive notes, economic activity in the goods-producing sector was strong; industrial electricity sales continued to climb on a quarterly year-over-year basis. The state’s housing market remained on the rebound as well; the median home price turned up for the first time since Fall 2010 on a quarterly year-over-year basis. In addition, three of the four leading indicators were up, which may suggest that the decline in the State Index in winter 2013 is more of a sign of the vulnerability of the state’s current economic conditions rather than an imminent recession.
Student Report by Ryan Bernier
Coös County Adapts to the Changing Health Care Landscape
Ever since the World Health Organization came out with its World Health Report in the year 2000, in which the United States was listed thirty-seventh in overall health care and the report revealed an astonishing gap between quality of care and overall cost of care, health care has become an increasingly popular political topic. Due to recent legislation at all levels of government, health care in the United States is currently undergoing major structural changes and leaders in the field consider the changes taking place to be ripe with uncertainty. “It is an exciting and interesting time to be in the health care industry.” Said Jonathan Brown, Director of Finance for Indian Stream Health Center, based in Colebrook. “The changes that are taking place are beyond many of us. I don’t know what to expect.”
In an effort to adapt to the changing legislative environment, the Northern New Hampshire Health Care Collaborative (NNHHC), was established in the summer of 2012. “It was a proactive effort based on the fact that we see significant changes in health care,” said Russell Keene, CEO of Androscoggin Valley Hospital in Berlin. The NNHHC is a limited liability corporation (LLC) which was established to ensure quality health care for Coös County and to control costs through innovation and shared resources. It is a partnership between Weeks Medical Center in Lancaster, the Upper Connecticut Valley Hospital in Colebrook and the Androscoggin Valley Hospital in Berlin. “The direction of health care is forcing people to take a broader look,” said Keene. “Part of that is understanding that you need to get involved in situations that allow us to lower costs.” As a result of utilizing shared resources, the Upper Connecticut Valley Hospital in Colebrook is now able to provide ENT, cardiology, neurology and prenatal services to people who live in the Colebrook area. This helps pregnant women and other patients who need specialized services, by saving them what would have been at least an additional hour long drive to a larger hospital. Through collaboration and shared resources the NNHHC hopes to continue similar improvements in the delivery of health care services in the North Country.
Much of the uncertainty surrounding health care in the United States comes from a well-known, controversial and complex piece of Federal legislation, known as the Patient Protection and Affordable Care Act (PPACA); passed by Congress in 2010 and recently upheld as Constitutional by the U.S. Supreme Court. Now that the Affordable Care Act has become the law of the land, it has shaken the landscape of the U.S. Health care system. Health care service providers have been forced to adapt to legislative changes in order to provide the same services and their ability to do so will have tremendous impacts on communities and households across the nation.
A paradigm shift in the health care service sector has caused health service professionals and patients to think more seriously about primary care and prevention as a means to lowering costs. One partnership that has been relevant to Northern New Hampshire is the North Country Health Consortium, established in 1997. The Consortium consists of about 30 organizations primarily from Coös, and Grafton County, which are dedicated to health and wellness. Through its partnerships the Consortium is working on several initiatives to improve techniques of prevention rather than to rely on traditional treatment and specialized care. Some of these initiatives include suicide prevention, nutrition, childhood obesity and substance abuse prevention.
The other major contributors in the regional health care system are Community Health Centers (CHCs). CHCs specialize in providing primary health care services in non-emergency situations. Indian Stream Health Center in Colebrook and Coös Family Health Services in Berlin are both CHCs which are also designated as Federally Qualified Health Centers (FQHC). As FQHCs, these two service providers are able to receive funding through a variety of State and Federal government programs. In 2014 a provision of the Affordable Care Act which will expand the eligibility requirements for Medicaid will take effect; boosting the number of people who are eligible for Medicaid benefits by an estimated 20 million. This will directly benefit the CHCs by significantly boosting their revenue. With the boost in revenue, Indian Stream Health Center and Coös Family Health Services and similar organizations will likely be able to hire more staff and add more services in the future.
This is a time in our nation’s history that is marked by drastic changes in how health care services are delivered to patients. The Affordable Care Act appears to be here to stay, and we will all have to wait and see what the real-world results will be. In Coös County, it has become increasingly important that health care service providers work together to adapt to these changes in order to provide a better quality service at a lower cost and meet the health care needs of a sparsely populated region. The new era in health care appears to be one in which collaboration, not competition between health care providers, reigns supreme – at least here in Coös County.
Coincident Index

 The Coos Coincident Index, which tracks the current state of the Coos economy, fell to 86.8 in Winter 2013 from Fall’s revised value of 87.2. On a quarterly year-over-year basis, the Index declined for the 8th quarter in a row.
 The New Hampshire Coincident Index inched down to 95.5 in Winter 2013 from Fall’s revised value of 95.7. On a quarterly year-over-year basis, the index fell for the first time since the end of Great Recession.
How strong are the forces of change?
In Winter, the Coos Coincident Index fell for the 8th quarter in a row on a quarterly year-over-year basis. All five component indicators turned down from their Winter 2011 levels. On a positive note, the pace of declines fell for the first time in a year. The State Index inched down for the first time on a quarterly year-over-year basis since the end of Great Recession. Three of the five component indicators were down from where they stood at the same time a year ago.
Household Employment
Household employment measures the number of employed residents. In contrast to non-farm payroll employment that is more commonly used in the national and state indexes, household employment includes self-employed, unpaid domestic help and both farm and non-farm workers, all of which may be more significant in rural than urban economy. Employment tends to rise as economy grows.
 Coos County

The employment index, adjusted for seasonal variation, contracted for the third time in five quarters. On a quarterly year-over-year basis, it fell for the ninth consecutive quarters.
New Hampshire
Employment at the state level, adjusted for seasonal variation, increased for the second quarter in a row. On a quarterly year-over-year basis, it continued to expand; but its pace of growth had declined four straight months.
Rooms Revenue
Rooms revenue represents spending on accommodations paid by travelers. It’s a good hospitality sector’s indicator in the sense that it’s not an estimate, but an official count as reported by the New Hampshire Department of Revenue Administration. However, it may not fully reflect changes in the overall activity level in the hospitality sector. Although it tracks a majority of overnight travelers, it excludes day travelers and overnight travelers staying with friends and family and those who have second homes. In the case of the northern regions of the state, the effect of the drawback is less of a concern since day travelers are a small minority due to the distance from the major urban areas.
Coos County

The estimated rooms and meals revenue, adjusted for inflation and smoothed by the four quarter moving average, increased for the first time since summer 2011. On a quarterly year-over-year basis, it fell four quarters in a row.
New Hampshire
The estimated rooms and meals revenue, adjusted for inflation and smoothed by the four quarter moving average, decreased for the third time in four quarters. On a quarterly year-over-year basis, it fell for the first time since Fall 2010.
Traffic Counts
It tracks the average vehicle traffic counts on Saturdays each quarter, which is automatically collected from traffic recorders located throughout the State. 12 recorders are selected to reflect traveler traffic in each of the seven travel regions in the State with two recorders from Coos County – Jefferson and Northumberland.
 Coos County

Average Saturday traffic counts, smoothed by the four quarter moving average, decreased three consecutive quarters. On a quarterly year-over-year basis, it declined two straight quarters.
New Hampshire
Average Saturday traffic counts, smoothed by the four quarter moving average, decreased for the second time in four quarters. On a quarterly year-over-year basis, it turned down for the sixth time in seven quarters.
Wages and Salaries
The estimated wage and salaries disbursements represent total compensation including pay for vacation, bonuses, stock options, and tips. This data is obtained from all workers covered under state and federal unemployment insurance laws; in other words, it is full population counts, not sample-based estimates. Unlike the household employment report, however, it excludes self-employed, domestic workers, and most agricultural workers. For this difference, wages and salaries series complements the number of employed residents in monitoring the labor market conditions as well as the economy. A change in wages and salaries, adjusted for inflation, may reflect changes in the number of jobs, the ratio between part-time and full-time jobs, and wage rates.
Coos County

The estimated wages and salary disbursement, adjusted for inflation and smoothed by the four quarter moving average, rose for the first time since Summer 2010. On a quarterly year-over-year basis, it continued to decline; but the pace of the declines fell for the fourth consecutive quarters.
New Hampshire
The estimated wages and salary disbursement, adjusted for inflation and smoothed by the four quarter moving average, decreased for the third time in four quarters. On a quarterly year-over-year basis, it decreased for the second time in four quarters.
Industrial Electricity Sales
It measures sales of electricity (kWh) to industrial customers. Utilities categorize consumers based on the North American Industry Classification System, demand, or usages. The industrial sector includes manufacturing, construction, mining, agriculture, fishing, and forestry establishments. Among these industries, manufacturing is a primary industry in Coos County making up 69% (73% for New Hampshire in 2008) of the total number of jobs in the industrial sector mentioned above according to the 2006 QCEW data. Therefore, a rise in industrial electricity sales may largely indicate invigorating manufacturing activities in the economy.
 Coos County

Industrial electricity sales, smoothed by four quarter moving average, fell for the 8th consecutive quarter. On a quarterly year-over-year basis, it fell for the 7th consecutive quarter.
New Hampshire
Industrial electricity sales, smoothed by the four quarter moving average, advanced five straight quarters. On a quarterly year-over-year basis, it expanded four quarters in a row.
Real Estate
NCEI reports two real estate market indicators – home sales and median home prices. The data tracks residential homes sold, including condos and manufactured homes. The health of the real estate sector is important to the broad economy due to its multiplier effect. Home transactions not only generate income for real estate brokers and mortgage bankers but also bring more businesses in other sectors including moving services, home furnishings and appliances. In order to minimize volatility in Coos real estate market, indicators are averaged over a four quarter period.
Coos County

The Coos housing market showed some signs of cooling in Winter 2013 after recent hot stretches of recovering. While the volume of sales was still expanding rapidly, home prices might be reaching a plateau. Home sales, smoothed by the four-quarter moving average, rose four quarters in a row at an increasing pace on a quarterly year-over-year basis. Median home prices, smoothed by the four-quarter moving average, rose five straight quarters on a quarterly year-over-year basis. But the pace of increases in prices dropped to a single digit for the first time in a year.
 New Hampshire
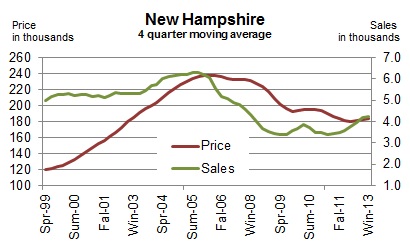
The state’s housing market also showed early signs of slowing. Home sales, smoothed by the four-quarter moving average, rose six quarters in a row on a quarterly year-over-year basis. But, the pace of increases inched down for the first time since the housing recovery began. The median home price, smoothed by four-quarter moving average, was up for the first time from the prior year. But whether this increase in home prices can be sustained largely depends on a continued expansion in home sales.
Leading Indicators
Leading indicators are to provide a sense of future economic conditions in the state of New Hampshire. The report includes 7 leading indicators grouped into three different categories – 1) four leading indicators for the broad economy of New Hampshire; 2) two leading indicators of the state’s hospitality industry; 3) a leading indicator of the U.S. economy. The list of leading indicators for New Hampshire’s economy includes initial unemployment claims, average weekly hours of work in the total private sector, building permits, and new business formation; the list for the state’s hospitality industry has gas price, and Canadian dollar; the report also includes interest rate spread between 10-year Treasury and federal funds for the U.S. economy. Although the list is by no means exhaustive and indicators often do not go back long enough in time for statistically robust analysis, we believe it can still be a helpful tool. Raw data are processed so as to make it easier to detect a change in the direction of the underlying trend in the economy. In the summary table below, “up” during recession indicates recovery around the corner while “down” during an expansion signals an impending recession. During expansion, the likelihood of recession increases when more indicators turn down persistently. For example, all four leading indicators of NH economy start posting “down” month after month at the beginning of the state’s 2008 recession. The New Hampshire recessions are defined as the period of declines in the New Hampshire Coincident Index published by the Philadelphia Federal Reserve Bank.
In February 2013, three of the four leading indicators for New Hampshire were up compared to six months ago in their year-over-year growth rate.

*These series are inverted so that an “up” means an improvement. Layoff decreases (inverted layoff increases) when the labor market conditions improve; and a decrease in gas prices (an increase in inverted gas prices) may help increase the number of travelers. **”Up” or “down” in this series is a change from prior month as opposed to from 6 months ago.
 Initial Unemployment Claims

The series is inverted so that an increase means an improvement. Initial claims decrease (inverted initial claims increase) when the labor market condition improves. The number of Initial claims tends to lead the business cycle. The chart demonstrates that it correctly predicted both the beginning and the ending of the past two recessions.
Average Weekly Hours of Work in Private Sector
It tends to turn before the economy does because employers often increase work hours of existing workers at the beginning of the recovery before committing to new hires; they do not want to take the risk of committing to new hires and seeing the economy fall back again. This data for New Hampshire only goes back to 2007.
 New Business Formation

All companies that want to do business in the state must register at the NH Secretary of State. This data includes all types of businesses including corporations and limited liabilities companies. The number of new businesses tends to lead the business cycle. Although this series goes back only to 2006, it correctly predicted the beginning and ending of the state’s 2008 recession. The series is smoothed by 12 month moving average.
Building Permits for Single Family Homes
It’s often the case housing recovery leads the broad economy out of recession. This is because of its extensive ripple effect over the rest of the economy. Building construction requires inputs from many other industries such as window manufacturing, logging, plumbing, electricity services, banking, and home furnishings such as consumer electronics and furniture. The 2001 recession was a mild recession and a rare one that did not involve a housing slump. The series is smoothed by four month moving average.
 Interest Rate Spread
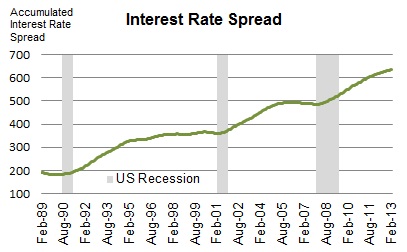
The interest rate spread, the 10 year Treasury less the Federal Funds, is considered one of the best leading indicators for the national economy. The indicator is the sum of all the past values plus the spread in the current period. Therefore, it decreases when the current spread is negative (the 10 year T rate is lower than the Fed Funds Rate), which is indicative of an impending recession.
Canadian Dollar

The value of Canadian dollar (the U.S. dollar per Canadian dollar) is an important indicator of the current and future tourism activity in the State of New Hampshire. Canada is the most important source of foreign travelers in the state. An increase in the value of Canadian dollar makes travel to the U.S. more affordable for Canadians. The chart on the right shows its recent relationship with spending on accommodations by travelers.
 Gas Price
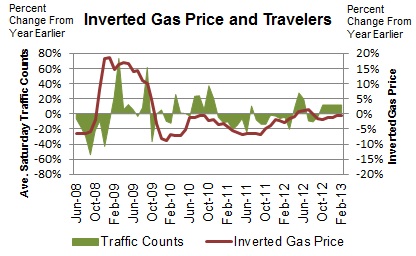
It’s the monthly average of weekly New England regular conventional retail gas prices. A significant decrease in gas prices makes traveling more affordable and can help increase the number of travelers to the state. When gas prices increase substantially, traffic counts tend to fall and vice versa. Gas prices are inverted so that an increase indicates improving conditions.
Technical Notes
- Employment is the number of people employed from the household survey.
- The current values of rooms and meals revenues are estimated using the data obtained from participating local hoteliers.
- The data series reported in the dollar values are adjusted for inflation.
- Real Estate data is obtained from the Northern New England Real Estate Network (NNEREN). All analysis and commentary related to the statistics is that of the authors, and not that of NNEREN.
© Copyright 2010: Daniel Lee and Vedran Lelas, College of Business Administration, Plymouth State University.