Strong and Broadening Recovery
In Fall 2013, there were signs that the fledgling recovery was getting stronger and spreading to the broader economy in Coos. The pace of growth in the County Index increased, while more indicators turned up. The year-over-year growth of the County Index accelerated since Summer 2012, when the Index started growing again for the first time since Winter 2011. Four of five component indicators turned up from Fall 2012. The rebounding labor market was reflective of the spreading recovery; the number of employed residents expanded three straight quarters on a year-over-year basis, and wages and salaries grew four consecutive quarters. The tourism sector continued to be the backbone of this recovery, although there were other positive factors, including the Burgess BioPower plant, the federal prison, and Gorham Paper and Tissue to a name a few.
The State’s economy grew stronger in Fall 2013. The pace of growth in the State Index accelerated for the third quarter in a row. All five component indicators turned up from the prior year. The tourism sector led the way for the state’s economy. More travelers came, and spent more money. But the economy was yet to show signs that it was back to the full strength. The labor market showed a mixed picture; the number of employed residents dipped after inching up four straight quarters, although the year-over-year growth of wages and salaries had been positive five straight quarters. As to the future economic activity, a group of leading indicators revealed no signs of a change in the direction of the economy. Two of the four state leading indicators were up in November; inverted initial unemployment claims and building permits for single family homes were up, while the average weekly hours of work and new business formation were down. The state’s housing market continued to expand, although there were signs that the boom was nearing its peak.
Student Report by Sean McGlynn
Collaboration is a necessity for economic development and success in rural counties, with Coös being no exception. The recent development of Ride the Wilds, one of the country’s most expansive ATV and snowmobile trails network, has helped develop a new market in the North Country and has shown what the region has to offer. “Today many vacationers are looking to have a totally different experience, an authentic adventure, the sort of thing that Coös County can provide” says Corrine Rober, Marketing Director of the Off Highway Recreational Vehicle Coalition (OHRV) which heads the Ride The Wilds project. Northern New Hampshire is one of the few places where ATV riding is being treated as an economic opportunity, and organic to the region, rather than as an environmental problem and nuisance. “Ride the Wilds has global potential, as there is little land in Europe where people can take part in activities like ATVing and snowmobiling”. The project has “unbelievable potential” to aid the development of all aspects of tourism within the North Country, as riders will need a place to stay, eat, and refuel their vehicles, notes Rober.
One of the places where this effect is most visible is in Colebrook, a town in dire need of economic development, especially after the recent shutdown of The Balsams. Steve Baillargeon, owner of Bear Rock ATV Rentals has seen the positive effect of Ride the Wilds first hand, and has also recognized the need for another market in the area: lodging. “ATVing is blowing up, but there is no lodging up here” says Steve. “People come up on their ATVs and then have to drive all the way back to Conway for a place to spend the night.” To help provide an answer to this lack of lodging, Steve is teaming up with Darrell Pack from Pack Custom Carpentry, LLC to offer a form of accommodations so new and interesting that it will likely become an attraction in its own right upon completion.
The name of this project is Digloos on the Wilds, an underground housing project that looks to fill the lodging needs of not just Ride the Wilds participants, but of anyone looking to experience the vast natural beauty that Colebrook has to offer; the area offers abundant opportunities for snowshoeing, fishing, kayaking, skiing and many other recreational activities. Pack Custom Carpentry will be teaming up with Formworks Building, Inc. of Durango, Colorado, a company with more than 30 years of experience in underground housing. Positioned just past the entrance of Bear Rock ATV Rentals, facing Dixville Notch, with Ride the Wilds’ trails intertwined throughout the property, Digloos has found a prime location, with over 400 acres for possible expansion, if the project takes off as anticipated. The project will start with ten super efficient underground homes, all facing the gorgeous Dixville Notch.
The homes will be able to sleep four adults, heat for 1/10th the energy of conventional structures of the same size, and are easily accessible to cars as well as off road vehicles. All homes will offer a view and outdoor fire pit where guests can relax after a long day of activities. Being underground, the noise of these vehicles will be of no disturbance to occupants of the properties. The progressive structures also use waste heat and geothermal transfer to heat walkways and melt ice, cutting down on maintenance costs. Priced at the low end of typical cabin rentals, this is an ideal lodging option for outdoor enthusiasts.
Pack Custom Carpentry will be looking locally for all of its interior needs. “Giving back to the community is the best marketing investment that you can make,” says Darrell Pack, which is why he will be turning to local crafters and artists to furnish and decorate the Digloos. He is also especially interested in local artists specializing in fiber optic lighting to help efficiently illuminate the underground homes. The Digloos will be “living showrooms” where guests can purchase any piece of artwork or furniture that catches their eye, says Pack. This is another effort at building the local area’s economy.
“This whole initiative can be just massive for the region” says Corrine Rober. When the tide rises all boats float, and it is hopeful that this will be the case for Colebrook and the surrounding regions. With the success of Ride the Wilds bringing opportunities for more businesses to develop, the future looks bright for further collaboration and strengthening of the economy within Coös County.
Pack Custom Carpentry, LLC hopes to start working on this project during spring 2014. The company is in serious talks with groups interested in the project, but is still looking for investors, preferably from New Hampshire. If you are interested, please contact Darrell Pack by email, at dpack@packcustomcarpentry.com
Coincident Index
The Coos Coincident Index, which tracks the current state of the Coos economy, rose to 89.8 in Fall 2013 from Summer’s revised value of 88.9. On a quarterly year-over-year basis, the Index increased for the second quarter in a row.

The New Hampshire Coincident Index increased to 97.1 in Fall 2013 from Summer’s revised value of 96.6. On a quarterly year-over-year basis, the index increased for the 13th consecutive quarters.
How strong are the forces of change?
In Fall, the Coos Coincident Index rose for the second quarter in a row at an increasing pace. Four of five component indicators turned up from their Fall 2012 levels. The State Index increased for the 13th quarter in a row on a quarterly year-over-year basis. All five component indicators were up from a year ago. The pace of growth increased three quarters in a row.
Household Employment
Household employment measures the number of employed residents. In contrast to non-farm payroll employment that is more commonly used in the national and state indexes, household employment includes self-employed, unpaid domestic help and both farm and non-farm workers, all of which may be more significant in rural than urban economy. Employment tends to rise as economy grows.
 Coos County

The employment index, adjusted for seasonal variation, increased for the third quarter in a row. On a quarterly year-over-year basis, it expanded three straight quarters after falling nine quarters in a row.
New Hampshire
Employment at the state level, adjusted for seasonal variation, decreased after increasing four consecutive quarters. On a quarterly year-over-year basis, though, it continued to expand.
Rooms Revenue
Rooms revenue represents spending on accommodations paid by travelers. It’s a good hospitality sector’s indicator in the sense that it’s not an estimate, but an official count as reported by the New Hampshire Department of Revenue Administration. However, it may not fully reflect changes in the overall activity level in the hospitality sector. Although it tracks a majority of overnight travelers, it excludes day travelers and overnight travelers staying with friends and family and those who have second homes. In the case of the northern regions of the state, the effect of the drawback is less of a concern since day travelers are a small minority due to the distance from the major urban areas.
Coos County

The estimated rooms and meals revenue, adjusted for inflation and smoothed by the four quarter moving average, increased for the fourth quarter in a row. On a quarterly year-over-year basis, it increased three straight quarters.
New Hampshire
The estimated rooms and meals revenue, adjusted for inflation and smoothed by the four quarter moving average, increased for the third consecutive quarter. On a quarterly year-over-year basis, it rose three straight quarters.
Traffic Counts
It tracks the average vehicle traffic counts on Saturdays each quarter, which is automatically collected from traffic recorders located throughout the State. 12 recorders are selected to reflect traveler traffic in each of the seven travel regions in the State with two recorders from Coos County – Jefferson and Northumberland.
 Coos County

Average Saturday traffic counts, smoothed by the four quarter moving average, increased two consecutive quarters. On a quarterly year-over-year basis, it bounced back after decreasing four straight quarters.
New Hampshire
Average Saturday traffic counts, smoothed by the four quarter moving average, increased for the third straight quarter. On a quarterly year-over-year basis, it expanded two consecutive quarters.
Wages and Salaries
The estimated wage and salaries disbursements represent total compensation including pay for vacation, bonuses, stock options, and tips. This data is obtained from all workers covered under state and federal unemployment insurance laws; in other words, it is full population counts, not sample-based estimates. Unlike the household employment report, however, it excludes self-employed, domestic workers, and most agricultural workers. For this difference, wages and salaries series complements the number of employed residents in monitoring the labor market conditions as well as the economy. A change in wages and salaries, adjusted for inflation, may reflect changes in the number of jobs, the ratio between part-time and full-time jobs, and wage rates.
Coos County

The estimated wages and salary disbursement, adjusted for inflation and smoothed by the four quarter moving average, expanded for the fourth time in five quarters. On a quarterly year-over-year basis, it expanded four straight quarters.
New Hampshire
The estimated wages and salary disbursement, adjusted for inflation and smoothed by the four quarter moving average, increased for the fourth time in five quarters. On a quarterly year-over-year basis, it increased for the fifth consecutive quarters.
Industrial Electricity Sales
It measures sales of electricity (kWh) to industrial customers. Utilities categorize consumers based on the North American Industry Classification System, demand, or usages. The industrial sector includes manufacturing, construction, mining, agriculture, fishing, and forestry establishments. Among these industries, manufacturing is a primary industry in Coos County making up 69% (73% for New Hampshire in 2008) of the total number of jobs in the industrial sector mentioned above according to the 2006 QCEW data. Therefore, a rise in industrial electricity sales may largely indicate invigorating manufacturing activities in the economy.
 Coos County
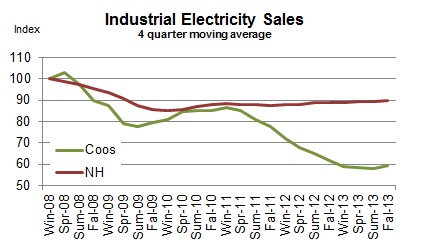
Industrial electricity sales, smoothed by four quarter moving average, rebounded for the first time since Winter 2011. On a quarterly year-over-year basis, it fell for the tenth consecutive quarter. But the pace of declines has slowed four straight quarters.
New Hampshire
Industrial electricity sales, smoothed by the four quarter moving average, inched up eight straight quarters. On a quarterly year-over-year basis, it expanded seven quarters in a row.
Real Estate
NCEI reports two real estate market indicators – home sales and median home prices. The data tracks residential homes sold, including condos and manufactured homes. The health of the real estate sector is important to the broad economy due to its multiplier effect. Home transactions not only generate income for real estate brokers and mortgage bankers but also bring more businesses in other sectors including moving services, home furnishings and appliances. In order to minimize volatility in Coos real estate market, indicators are averaged over a four quarter period.
Coos County

In Fall 2013, there have been increasing signs that the housing market boom in the County is nearing its peak. Although both home sales and prices continued to grow, the pace of growth in home sales declined three straight months and the pace of growth in median home prices was down to a single digit from 23.6% in Spring 2012 when it marked the fastest growth since the housing market recovery began.
 New Hampshire

The state’s housing market also showed early signs of slowing. The pace of growth in home sales, smoothed by the four-quarter moving average, decreased to 12.7%, the slowest since Spring 2012. The median home price, smoothed by four quarter moving average, increased at a faster clip three quarters in a row. However, home prices may also follow the recent trends in home sales, as they tend to lag home sales.
Leading Indicators
Leading indicators are to provide a sense of future economic conditions in the state of New Hampshire. The report includes 7 leading indicators grouped into three different categories – 1) four leading indicators for the broad economy of New Hampshire; 2) two leading indicators of the state’s hospitality industry; 3) a leading indicator of the U.S. economy. The list of leading indicators for New Hampshire’s economy includes initial unemployment claims, average weekly hours of work in the total private sector, building permits, and new business formation; the list for the state’s hospitality industry has gas price, and Canadian dollar; the report also includes interest rate spread between 10-year Treasury and federal funds for the U.S. economy. Although the list is by no means exhaustive and indicators often do not go back long enough in time for statistically robust analysis, we believe it can still be a helpful tool. Raw data are processed so as to make it easier to detect a change in the direction of the underlying trend in the economy. In the summary table below, “up” during recession indicates recovery around the corner while “down” during an expansion signals an impending recession. During expansion, the likelihood of recession increases when more indicators turn down persistently. For example, all four leading indicators of NH economy start posting “down” month after month at the beginning of the state’s 2008 recession. The New Hampshire recessions are defined as the period of declines in the New Hampshire Coincident Index published by the Philadelphia Federal Reserve Bank.
In November 2013, two of the four leading indicators for New Hampshire were up compared to six months ago in their year-over-year growth rate.

*These series are inverted so that an “up” means an improvement. Layoff decreases (inverted layoff increases) when the labor market conditions improve; and a decrease in gas prices (an increase in inverted gas prices) may help increase the number of travelers. **”Up” or “down” in this series is a change from prior month as opposed to from 6 months ago.
 Initial Unemployment Claims
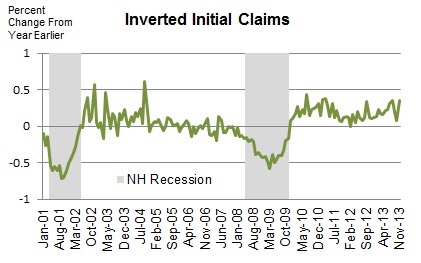
The series is inverted so that an increase means an improvement. Initial claims decrease (inverted initial claims increase) when the labor market condition improves. The number of Initial claims tends to lead the business cycle. The chart demonstrates that it correctly predicted both the beginning and the ending of the past two recessions.
Average Weekly Hours of Work in Private Sector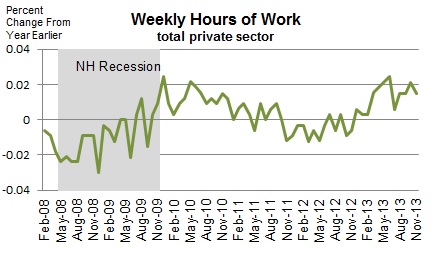
It tends to turn before the economy does because employers often increase work hours of existing workers at the beginning of the recovery before committing to new hires; they do not want to take the risk of committing to new hires and seeing the economy fall back again. This data for New Hampshire only goes back to 2007.
 New Business Formation

All companies that want to do business in the state must register at the NH Secretary of State. This data includes all types of businesses including corporations and limited liabilities companies. The number of new businesses tends to lead the business cycle. Although this series goes back only to 2006, it correctly predicted the beginning and ending of the state’s 2008 recession. The series is smoothed by 12 month moving average.
Building Permits for Single Family Homes
It’s often the case housing recovery leads the broad economy out of recession. This is because of its extensive ripple effect over the rest of the economy. Building construction requires inputs from many other industries such as window manufacturing, logging, plumbing, electricity services, banking, and home furnishings such as consumer electronics and furniture. The 2001 recession was a mild recession and a rare one that did not involve a housing slump. The series is smoothed by four month moving average.
 Interest Rate Spread
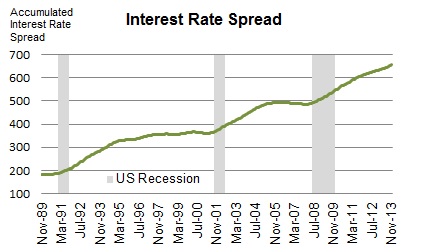
The interest rate spread, the 10 year Treasury less the Federal Funds, is considered one of the best leading indicators for the national economy. The indicator is the sum of all the past values plus the spread in the current period. Therefore, it decreases when the current spread is negative (the 10 year T rate is lower than the Fed Funds Rate), which is indicative of an impending recession.
Canadian Dollar

The value of Canadian dollar (the U.S. dollar per Canadian dollar) is an important indicator of the current and future tourism activity in the State of New Hampshire. Canada is the most important source of foreign travelers in the state. An increase in the value of Canadian dollar makes travel to the U.S. more affordable for Canadians. The chart on the right shows its recent relationship with spending on accommodations by travelers.
 Gas Price

It’s the monthly average of weekly New England regular conventional retail gas prices. A significant decrease in gas prices makes traveling more affordable and can help increase the number of travelers to the state. When gas prices increase substantially, traffic counts tend to fall and vice versa. Gas prices are inverted so that an increase indicates improving conditions.
Technical Notes
- Employment is the number of people employed from the household survey.
- The current values of rooms and meals revenues are estimated using the data obtained from participating local hoteliers.
- The data series reported in the dollar values are adjusted for inflation.
- Real Estate data is obtained from the Northern New England Real Estate Network (NNEREN). All analysis and commentary related to the statistics is that of the authors, and not that of NNEREN.
© Copyright 2010: Daniel Lee and Vedran Lelas, College of Business Administration, Plymouth State University.