Slowing Recovery
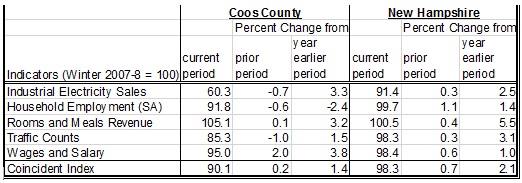
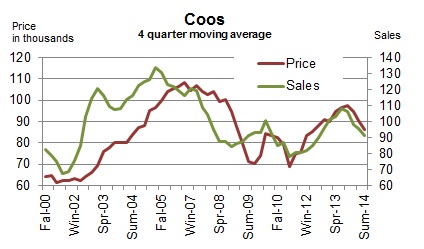
The economic activity decreased in Coos County between summer 2014 and summer 2013. The Economic Index fell for the first time since Winter 2013 on a year-over-year basis. The pace of growth decreased steadily for three straight quarters. Though, three of the five component indicators still remained up from their 2013 summer levels. The decline in the economic activity was attributed largely to the struggling goods-producing sector and the stagnant labor market. Number of employed residents declined two quarters in a row on a year-over-year basis, while industrial electricity sales fell after increasing two consecutive quarters. The County’s housing market activity fell; both home sales and median home prices decreased from a year earlier. On a positive note, the tourism sector continued to grow; both average Saturday vehicle traffic counts and spending at lodgings were up from the prior year. But the pace of growth in spending at lodgings declined three straight quarter.
The State’s economy remained on track to recovery in summer 2014. The State Index increased 16 consecutive quarters on a year-over-year basis. All five component indicators remained up from the prior year. But, the pace of growth fell after increasing two straight quarters. The industrial sector continued to get stronger; industrial electricity sales grew ten consecutive quarters. The labor market remained strong as well; the number of employed residents expanded on a year-over-year basis. The tourism sector continued to be a force behind the recovery; Saturday vehicle traffic counts rose five quarters in a row and spending at lodgings increased six consecutive quarters on a year-over-year basis. The state’s housing market cooled off; home sales declined from prior year for the first time since summer 2011. Lastly, we are excited to announce an addition of a leading indicator for the state’s tourism industry. It is reported at the bottom of the leading indicator section.
Student Report by Sean McGlynn
Trying to stimulate the economy of a region is never as simple as creating jobs or raising wages. Positive economic growth considers not only the financial health of a region, but also respects the culture, health, history, and environment of a given area. While Coös County’s economy typically trails state and regional averages, it has long been regarded for its environmental, historical and cultural richness. The North Country Farmers Co-op and supplementing organizations are working to conserve and boost not just the economy, but all of these factors.
The Co-op is part of a much larger movement to shed light on the benefits of eating local and supporting local farmers. “Across the country local farming is growing; people are more aware of the foods they are eating, and the outcome (of those foods) on their health,” says Kevin Hurley, a part-time organic farmer in Colebrook.
Unofficially formed in 2007 by Julie Moran, with 7 farms and $4,668 in sales, the Co-op has grown continuously: it now has 25 members and saw over $50,000 in sales this season, despite a terrible year for growing produce. The Co-op uses collaboration to help its members target a wider and more reliable market. Without competition from other local farms, as well as a streamlined delivery and ordering process, members can consistently sell to markets that were previously inaccessible. “The Co-op has helped out immensely, it has opened up markets that we didn’t used to have. You can only sell so much in the surrounding area,” says Hurley. The Co-op has also helped members realize which products are more profitable than others, and develop strategies to make the most of their time, space and energy. “Some farms have doubled every year since the start of the Co-op,” says Julie Moran, “while other farms have changed their product lines to make more revenue”. Although she is disappointed about the 2014 season, Moran is very excited and hopeful about the future of the Co-op, expecting to add 10 more members for the 2015 season.
The North Country is coming up with other innovative ways to get local, organic foods to consumers, such as North Country Marketplace in Colebrook. Currently listed as a retail business, North Country Marketplace, or “Bev’s”, as it is affectionately referred to by those familiar with its rustic interior and delicious local produce, is fighting for a new business classification in Concord. “There is quite a large gap between what is retail and what is a farm stand,” says Bev White, owner of North Country Marketplace. “Rather than me taking a cut out of sales made at the store, farmers pay a low rental fee to have their own section here,” which clearly separates it from your typical retail store. North Country Marketplace is essentially an off-site farm stand, where local growers can sell and showcase their products. However, “Bev’s” is not technically a farm stand, as goods must be sold on site at the farms. It also fails to meet New Hampshire Department of Agriculture’s tight restrictions defining a Farmer’s Market.
North Country Marketplace’s bid for new legislation has received opposition from the Department of Agriculture, the New Hampshire Farm Bureau as well as Health and Human Services. The New England Farmer’s Union however, does support their objective. “The goal is to educate state legislators; this is a model that can work anywhere for the farmer and the public” says Bev White. “It makes perfect sense for the economics of the area, and is working for the public, growers and producers.”
Just talking about the legislation process gets to Julie Moran. “We’re not used to being political,” she says, clearly bothered by the topic. Despite the challenges Julie remains determined and optimistic. “I fully expect that people will be making a full living off this in the future” says Julie Moran, “it may take 10 or 15 years, but we’ll get there.”
Visit http://ncfcoop.com/ and http://www.marketplaceandsalvage.com/ for more information on both the North Country Farmer’s Co-op and North Country Marketplace.
Coincident Index
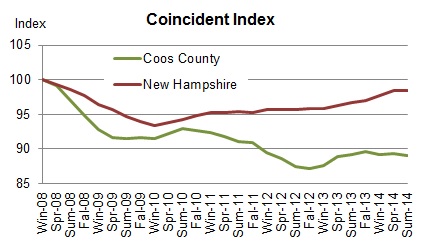
 The Coos Coincident Index, which tracks the current state of the Coos economy, fell to 89.0 in Summer 2014 from Spring’s revised value of 89.3. On a quarterly year-over-year basis, the Index decreased after increasing five quarters in a row.
 The New Hampshire Coincident Index inched up to 98.5 in Summer 2014 from Spring’s revised value of 98.4. On a quarterly year-over-year basis, the index increased for the 16th consecutive quarters.
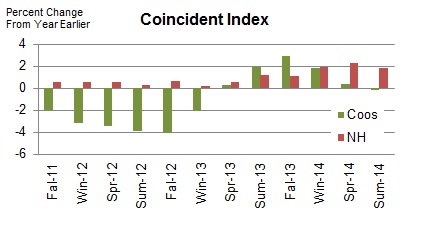
How strong are the forces of change?
In Summer 2014, the Coos Coincident Index fell for the first time since Winter 2013. The pace of growth decreased steadily for three straight quarters. Three of the five component indicators remained up from their Summer 2013 levels. The State Index increased for the 16th quarter in a row on a quarterly year-over-year basis. All five component indicators remained up from a year ago. But the pace of growth decreased after increasing two quarters in a row.
Household Employment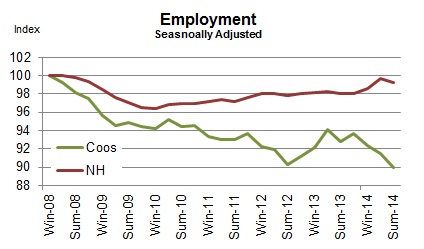
Household employment measures the number of employed residents. In contrast to non-farm payroll employment that is more commonly used in the national and state indexes, household employment includes self-employed, unpaid domestic help and both farm and non-farm workers, all of which may be more significant in rural than urban economy. Employment tends to rise as economy grows.
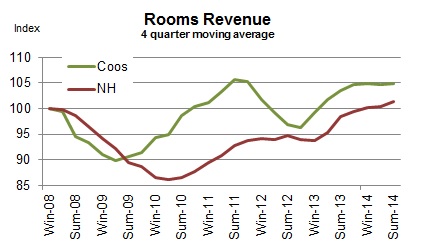 Rooms Revenue
Rooms revenue represents spending on accommodations paid by travelers. It’s a good hospitality sector’s indicator in the sense that it’s not an estimate, but an official count as reported by the New Hampshire Department of Revenue Administration. However, it may not fully reflect changes in the overall activity level in the hospitality sector. Although it tracks a majority of overnight travelers, it excludes day travelers and overnight travelers staying with friends and family and those who have second homes. In the case of the northern regions of the state, the effect of the drawback is less of a concern since day travelers are a small minority due to the distance from the major urban areas.
Traffic Counts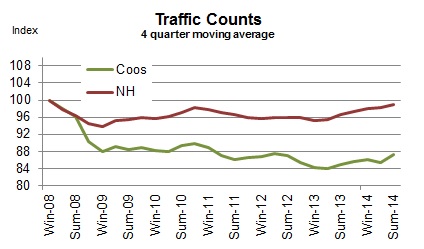
It tracks the average vehicle traffic counts on Saturdays each quarter, which is automatically collected from traffic recorders located throughout the State. 12 recorders are selected to reflect traveler traffic in each of the seven travel regions in the State with two recorders from Coos County – Jefferson and Northumberland.
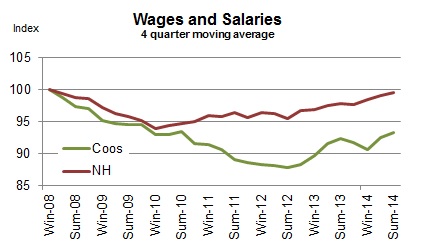 Wages and Salaries
The estimated wage and salaries disbursements represent total compensation including pay for vacation, bonuses, stock options, and tips. This data is obtained from all workers covered under state and federal unemployment insurance laws; in other words, it is full population counts, not sample-based estimates. Unlike the household employment report, however, it excludes self-employed, domestic workers, and most agricultural workers. For this difference, wages and salaries series complements the number of employed residents in monitoring the labor market conditions as well as the economy. A change in wages and salaries, adjusted for inflation, may reflect changes in the number of jobs, the ratio between part-time and full-time jobs, and wage rates.
Industrial Electricity Sales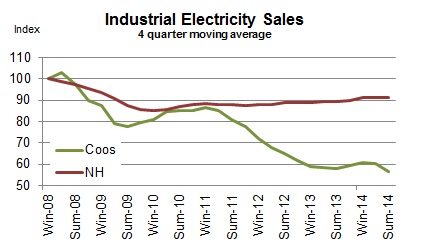
It measures sales of electricity (kWh) to industrial customers. Utilities categorize consumers based on the North American Industry Classification System, demand, or usages. The industrial sector includes manufacturing, construction, mining, agriculture, fishing, and forestry establishments. Among these industries, manufacturing is a primary industry in Coos County making up 69% (73% for New Hampshire in 2008) of the total number of jobs in the industrial sector mentioned above according to the 2006 QCEW data. Therefore, a rise in industrial electricity sales may largely indicate invigorating manufacturing activities in the economy.
Real Estate
NCEI reports two real estate market indicators – home sales and median home prices. The data tracks residential homes sold, including condos and manufactured homes. The health of the real estate sector is important to the broad economy due to its multiplier effect. Home transactions not only generate income for real estate brokers and mortgage bankers but also bring more businesses in other sectors including moving services, home furnishings and appliances. In order to minimize volatility in Coos real estate market, indicators are averaged over a four quarter period.
 Coos County
In Summer 2014, the county’s housing market dampened. The volume of home sales, smoothed by four quarter moving average, fell three quarters in a row on a year-over-year basis. The median home price, smoothed by four quarter moving average, decreased for the second straight quarter on a year-over-year basis.
New Hampshire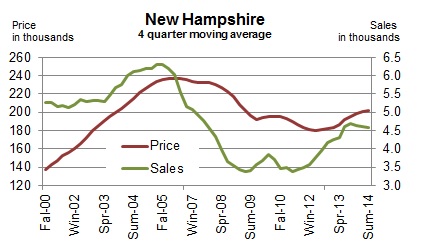
The state’s housing market cooled off. The volume of home sales, smoothed by the four-quarter moving average, decreased for the first time since Summer 2011. The pace of increases in median home price, smoothed by four quarter moving average, decreased for the second consecutive quarter.
Leading Indicators
Leading indicators are to provide a sense of future economic conditions in the state of New Hampshire. The report includes 7 leading indicators grouped into three different categories – 1) four leading indicators for the broad economy of New Hampshire; 2) two leading indicators of the state’s hospitality industry; 3) a leading indicator of the U.S. economy. The list of leading indicators for New Hampshire’s economy includes initial unemployment claims, average weekly hours of work in the total private sector, building permits, and new business formation; the list for the state’s hospitality industry has gas price, and Canadian dollar; the report also includes interest rate spread between 10-year Treasury and federal funds for the U.S. economy. Although the list is by no means exhaustive and indicators often do not go back long enough in time for statistically robust analysis, we believe it can still be a helpful tool. Raw data are processed so as to make it easier to detect a change in the direction of the underlying trend in the economy. In the summary table below, “up” during recession indicates recovery around the corner while “down” during an expansion signals an impending recession. During expansion, the likelihood of recession increases when more indicators turn down persistently. For example, all four leading indicators of NH economy start posting “down” month after month at the beginning of the state’s 2008 recession. The New Hampshire recessions are defined as the period of declines in the New Hampshire Coincident Index published by the Philadelphia Federal Reserve Bank.
In August 2014, two of the four New Hampshire leading indicators were up compared to six months ago in their year-over-year growth rate.
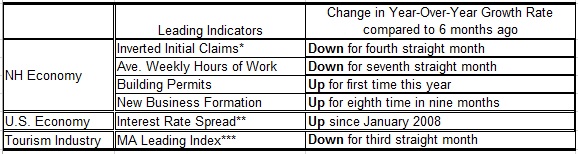
*This series is inverted so that an “up” means an improvement. Layoffs decrease (inverted layoff increases) when the labor market conditions improve.
**”Up” or “down” is a change in the spread from prior month.
***”Up” or “down” is a change in the Index from six month ago.
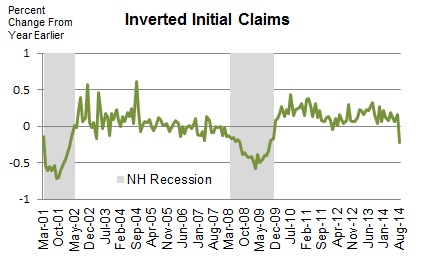 Initial Unemployment Claims
The series is inverted so that an increase means an improvement. Initial claims decrease (inverted initial claims increase) when the labor market condition improves. The number of Initial claims tends to lead the business cycle. The chart demonstrates that it correctly predicted both the beginning and the ending of the past two recessions.
Average Weekly Hours of Work in Private Sector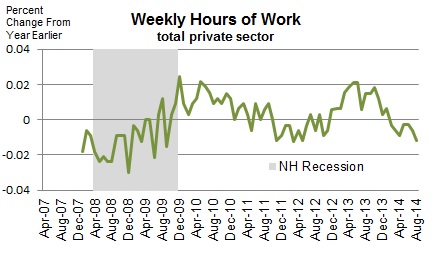
It tends to turn before the economy does because employers often increase work hours of existing workers at the beginning of the recovery before committing to new hires; they do not want to take the risk of committing to new hires and seeing the economy fall back again. This data for New Hampshire only goes back to 2007.
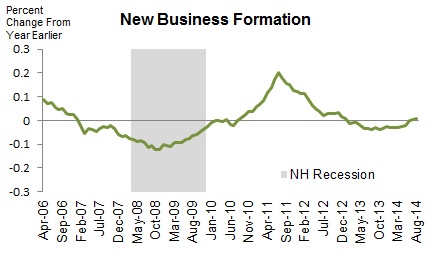 New Business Formation
All companies that want to do business in the state must register at the NH Secretary of State. This data includes all types of businesses including corporations and limited liabilities companies. The number of new businesses tends to lead the business cycle. Although this series goes back only to 2006, it correctly predicted the beginning and ending of the state’s 2008 recession. The series is smoothed by 12 month moving average.
Building Permits for Single Family Homes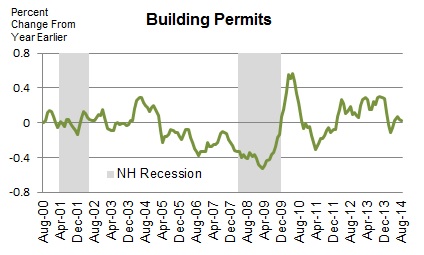
It’s often the case housing recovery leads the broad economy out of recession. This is because of its extensive ripple effect over the rest of the economy. Building construction requires inputs from many other industries such as window manufacturing, logging, plumbing, electricity services, banking, and home furnishings such as consumer electronics and furniture. The 2001 recession was a mild recession and a rare one that did not involve a housing slump. The series is smoothed by four month moving average.
Interest Rate Spread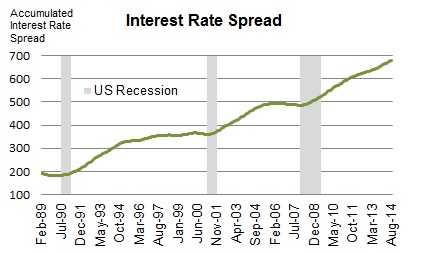
The interest rate spread, the 10 year Treasury less the Federal Funds, is considered one of the best leading indicators for the national economy. The indicator is the sum of all the past values plus the spread in the current period. Therefore, it decreases when the current spread is negative (the 10 year T rate is lower than the Fed Funds Rate), which is indicative of an impending recession.
Massachusetts Leading Index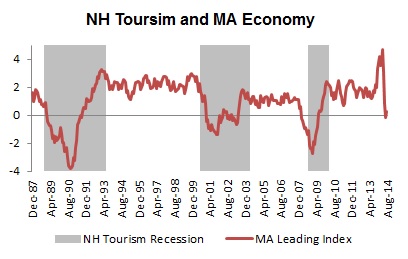
The state of Massachusetts economy is critical for the New Hampshire’s tourism industry, since the largest share of visitors to New Hampshire come from Massachusetts. Therefore, the Massachusetts Leading Index may also shed light on the future performance of the New Hampshire’s tourism industry. The MA Leading Index is published by the Philadelphia Federal Reserve Bank. A New Hampshire tourism recession was defined as a period of declines in the year-over-year growth of real spending at lodgings.
Technical Notes
- Employment is the number of people employed from the household survey.
- The current values of rooms and meals revenues are estimated using the data obtained from participating local hoteliers.
- The data series reported in the dollar values are adjusted for inflation.
- Real Estate data is obtained from the Northern New England Real Estate Network (NNEREN). All analysis and commentary related to the statistics is that of the authors, and not that of NNEREN.
© Copyright 2010: Daniel Lee and Vedran Lelas, College of Business Administration, Plymouth State University.