Foreign Subsidiaries Have a Notable Presence in New Hampshire
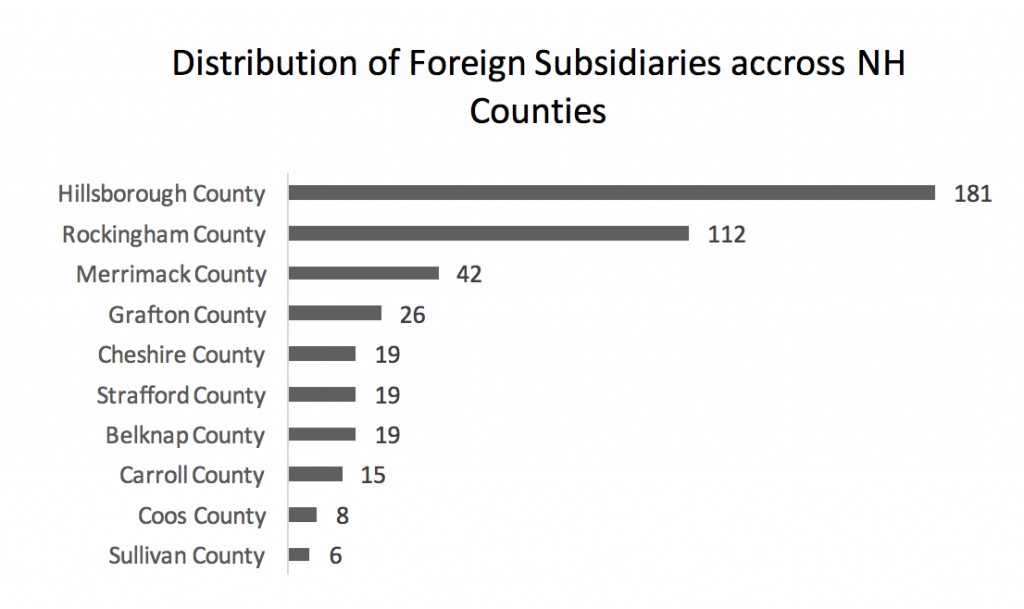
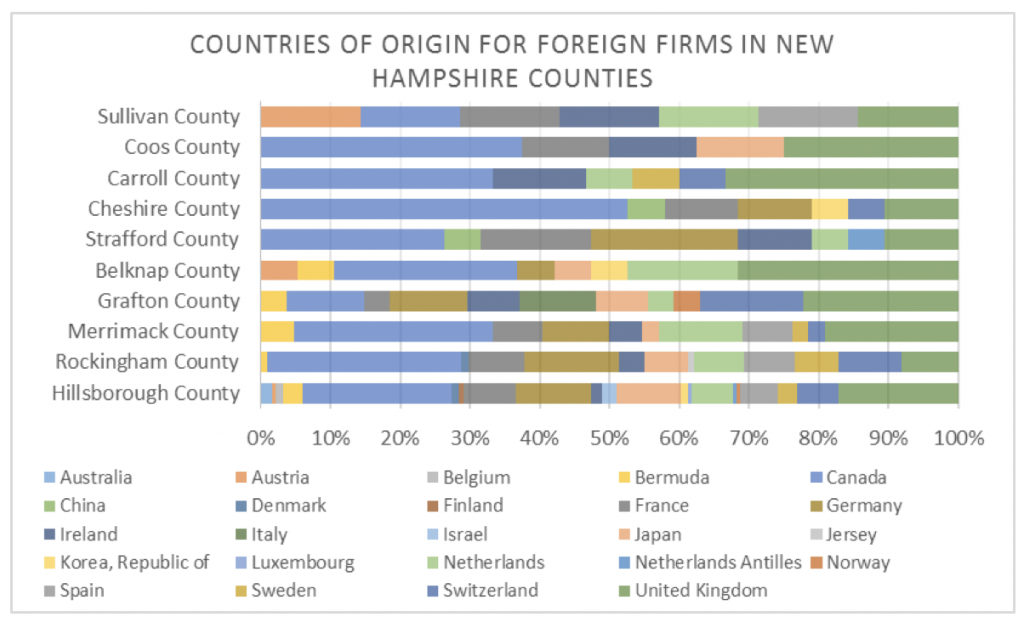
The present study analyzes the distribution of foreign subsidiaries[i] (i.e., firms that are part of companies with headquarters in a country other than US) in New Hampshire. A unique feature of the research is the examination of the presence of foreign firms across counties. Based on the sample of firms included in the study, most foreign firms operate in Hillsborough County, followed by Rockingham and Merrimack Counties. Sullivan, Coos and Carroll are counties where the lowest numbers of foreign subsidiaries can be found. Total number of firms in Hillsborough and Rockingham counties is almost double the total number of foreign subsidiaries in all other New Hampshire counties.
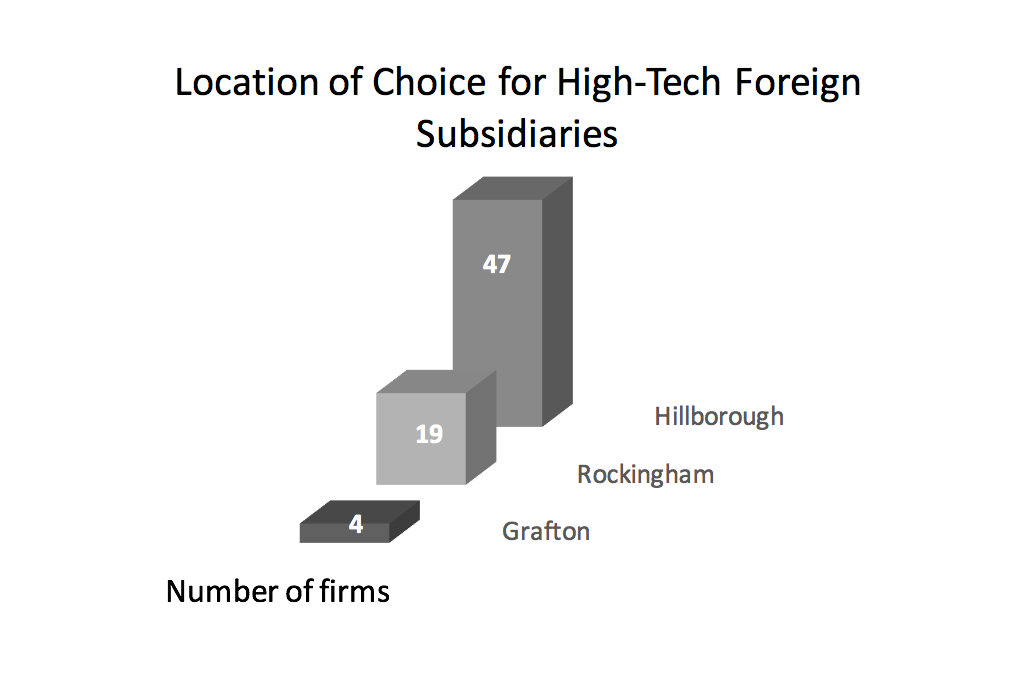
Hillsborough and Rockingham not only have the highest numbers of foreign firms but also the highest numbers of high-tech foreign firms. In a 2017 report[ii], SelectUSA of the US Department of Commerce found that foreign direct investment is a significant contributor to the competitiveness of the US high-tech sector (also referred to as advanced industries). According to SelectUSA, “high-tech industries are important drivers of growth for the U.S. economy. These industries advance innovation, employ millions of highly skilled and highly educated workers, further U.S. competitiveness in an increasingly globalized world, and contribute to greater prosperity in our communities.” Following the methodology used by SelectUSA, the present report for New Hampshire identifies the distribution of high-tech foreign subsidiaries across counties. The largest number of high-tech foreign subsidiaries are in Hillsborough County. Rockingham and Grafton Counties have the second and third numbers of high-tech foreign subsidiaries.
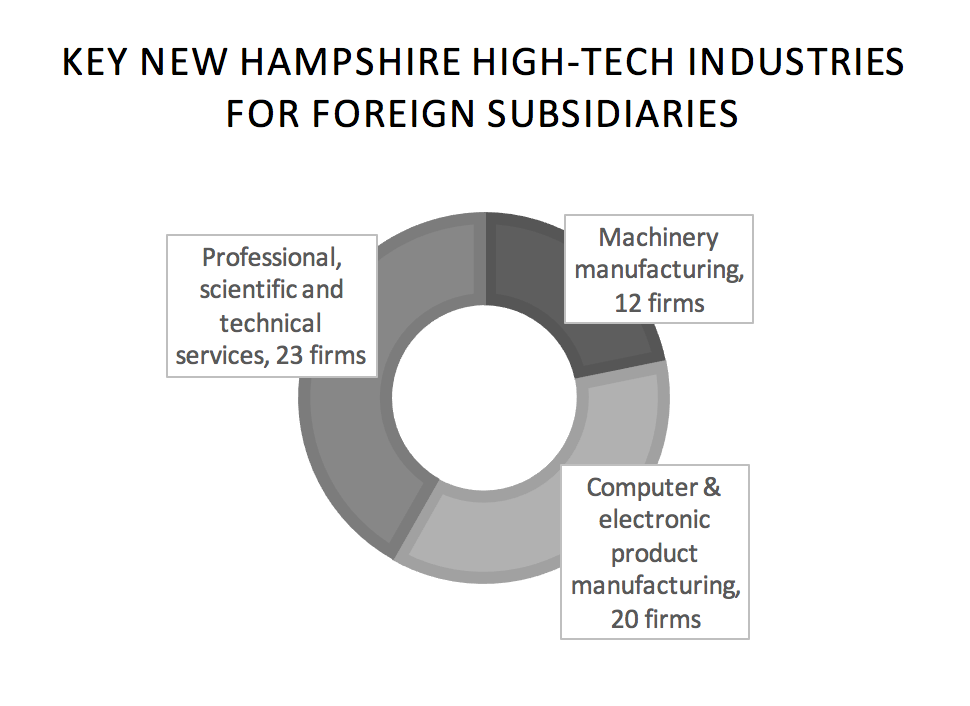
Considering the distribution of high-tech foreign firms across industries[iii], the present report finds that most high-tech foreign subsidiaries offer professional, scientific and technical services. A slightly lower number of foreign firms operate in the high-tech industry of computer and electronic product manufacturing. Machinery manufacturing is the next represented high-tech industry.
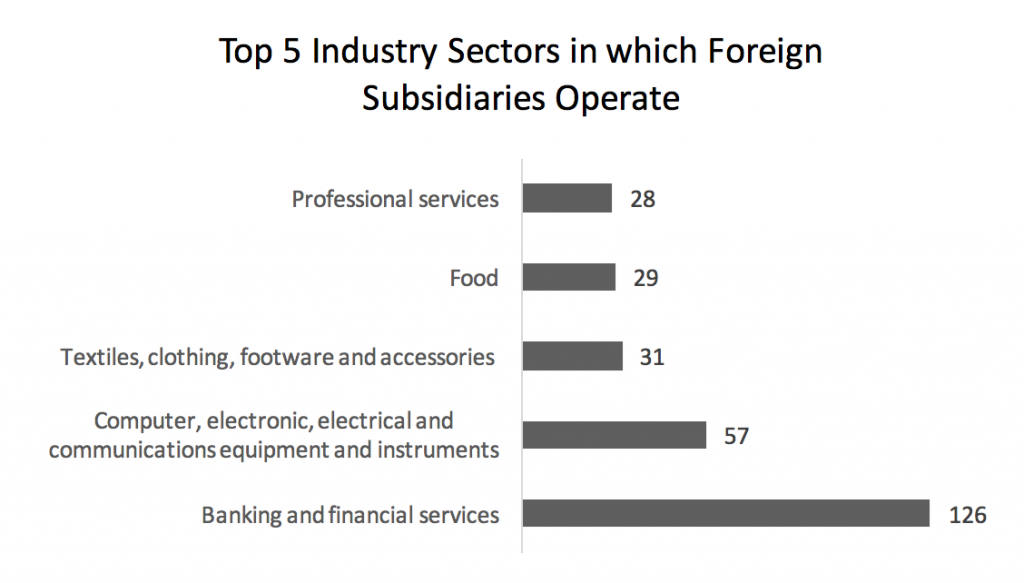
For the purpose of understanding more about foreign firms’ representation in our state, 20 industry sectors were created. The distribution of foreign subsidiaries across these sectors identifies banking and financial services as the sector with most foreign subsidiaries. Computer, electronics, electrical and communications equipment and instruments is the second represented sector, with about half the foreign firms as compared with the number of foreign firms in the top sector.
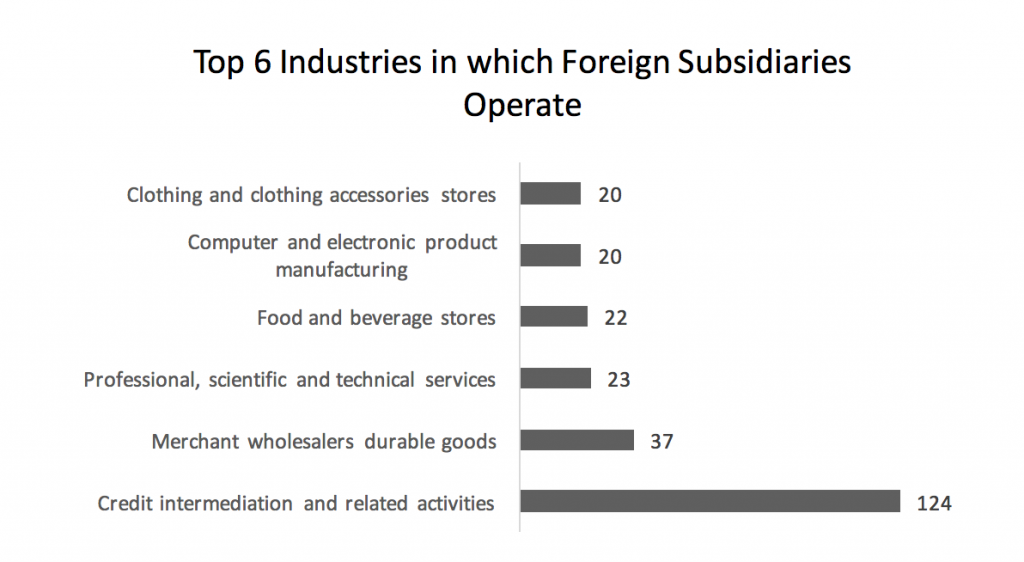
The diversity of industries[iv] where foreign subsidiaries operate in New Hampshire is interesting. While these firms operate in a variety of industries, a relatively large number are present in the credit intermediation and related activities industry. The distribution shows the predominance of this industry and second highest number of foreign subsidiaries that are merchant wholesalers of durable goods. Lower numbers of foreign firms follow in the rankings and represent professional, scientific and technical services firms; food and beverage stores; clothing and clothing accessories stores; and computer and electronic product manufacturing firms. The least represented industries in the ranking have only one foreign subsidiary each[v].

To add detail to the visualization above, the top industries by number of foreign firms are shown below with the accompanying number of firms in each.
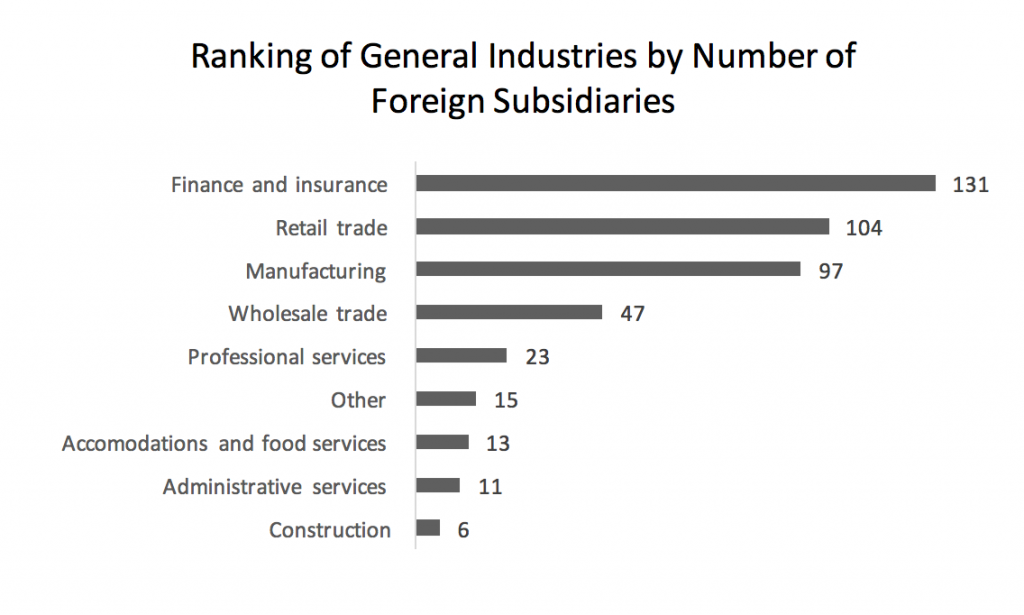
The aggregation at a more general industry level[vi] identifies that retail trade and manufacturing follow finance and insurance in terms of industries where foreign firms operate in New Hampshire. In this more general classification, construction, administrative services and accommodations and food services have low numbers of foreign subsidiaries, whilst professional services and wholesale trade trail behind the top 3 activities.
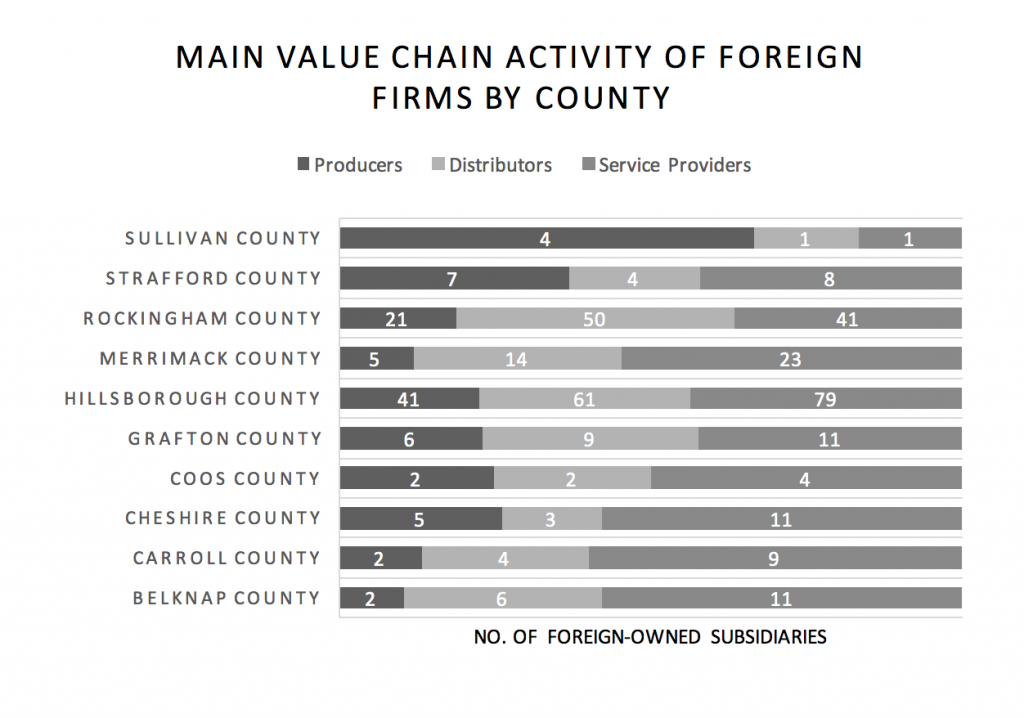
The main value chain activity has been used in this study to categorize foreign subsidiaries as producers, distributors or service providers. The analysis identifies a predominance of service providers in New Hampshire counties, with the exception of Rockingham and Sullivan. The representation of producers varies by county. In relative county-level numbers, producers are more prevalent in Sullivan, and come second as representation in Strafford and Cheshire. Distributors have the most representation by numbers in Rockingham, and come second in Merrimack, Hillsborough, Grafton, Carroll and Belknap counties. By absolute numbers, foreign service providers are present in higher numbers than foreign producers and distributors. Producers foreign subsidiaries are roughly about half of the number of service providers.
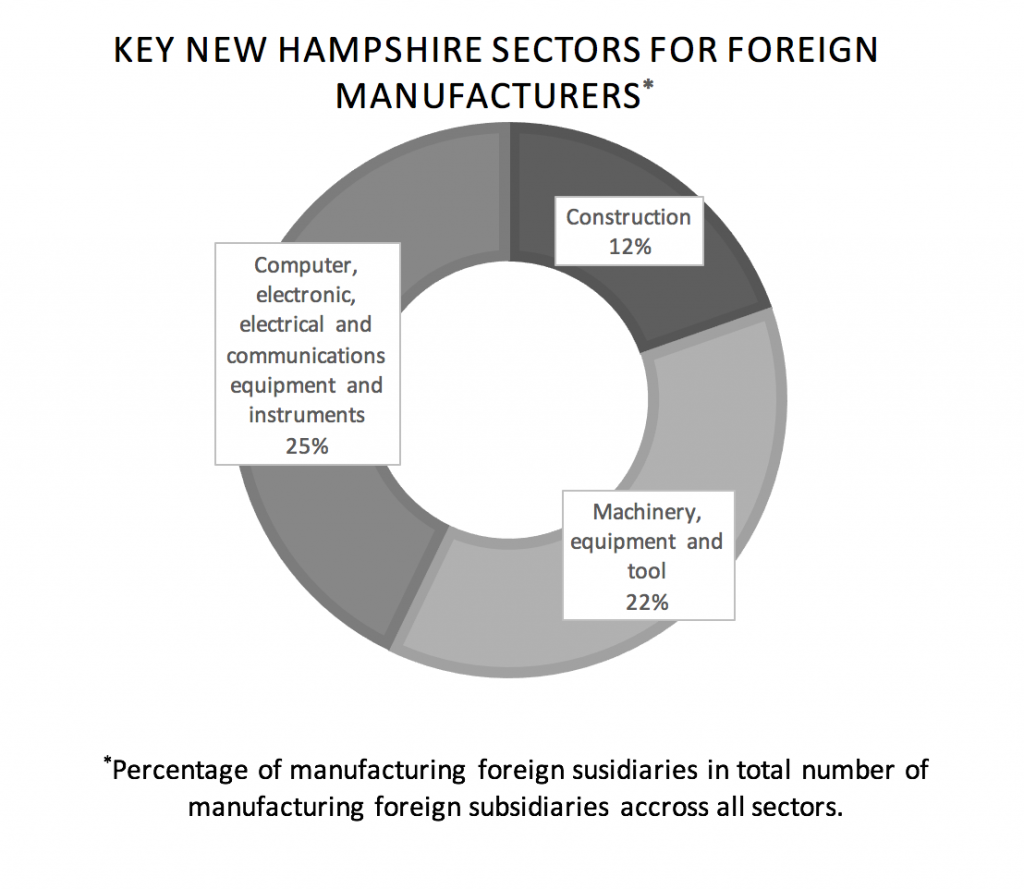
A ranking of the New Hampshire sectors by number of foreign manufacturers reveals that most of these companies are in the computer, electronic, electrical and communications equipment and instruments sector, with an almost similar number of foreign manufacturers in the machinery, equipment and tool sector. The representation in the next sector – construction – is halved, comparatively.
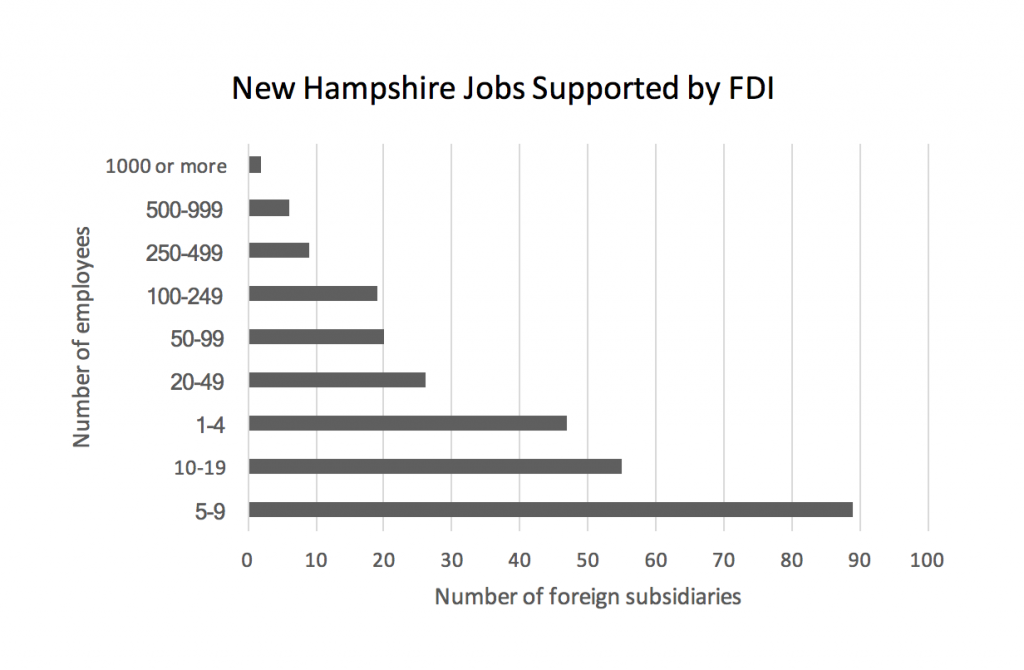
It is mostly small foreign firms that are employers in New Hampshire[vii]. According to a reduced sample[viii] of firms for which employment data was available from public sources, 70% of foreign subsidiaries have fewer than 20 employees and only 1% of companies are large, with over 1000 employees.
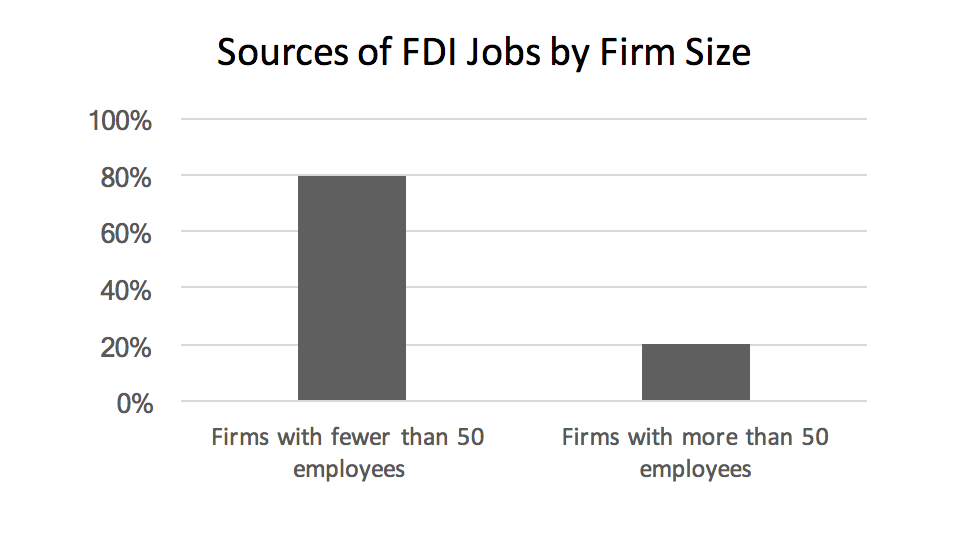
The analysis[ix] of this reduced sample indicates that foreign subsidiaries that hire employees in New Hampshire are predominantly firms with fewer than 50 employees. More specifically, most foreign subsidiaries employ 5-9 employees, with 2nd and 3rd representations by subsidiaries employing 10-19 individuals and subsidiaries employing 1-4 individuals, respectively. At the other end of the range, the number of firms employing more than 250 employees is relatively low, with foreign subsidiaries representations decreasing in each category of firm size as size increases over 100 employees.
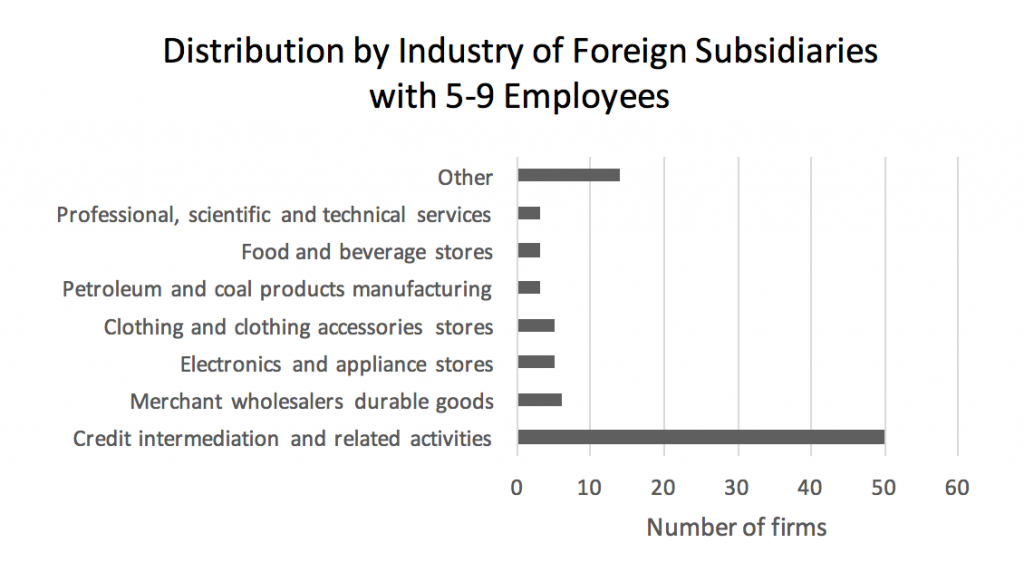
A more detailed analysis across industries[x] of the foreign firms with 5-9 employees identifies the fact that most of these firms operate in the largest overall represented industry of credit intermediation. By number of foreign subsidiaries, merchant wholesalers of durable goods follow but with much fewer firms, tracked closely by electronics and appliance stores and clothing and clothing accessories stores.
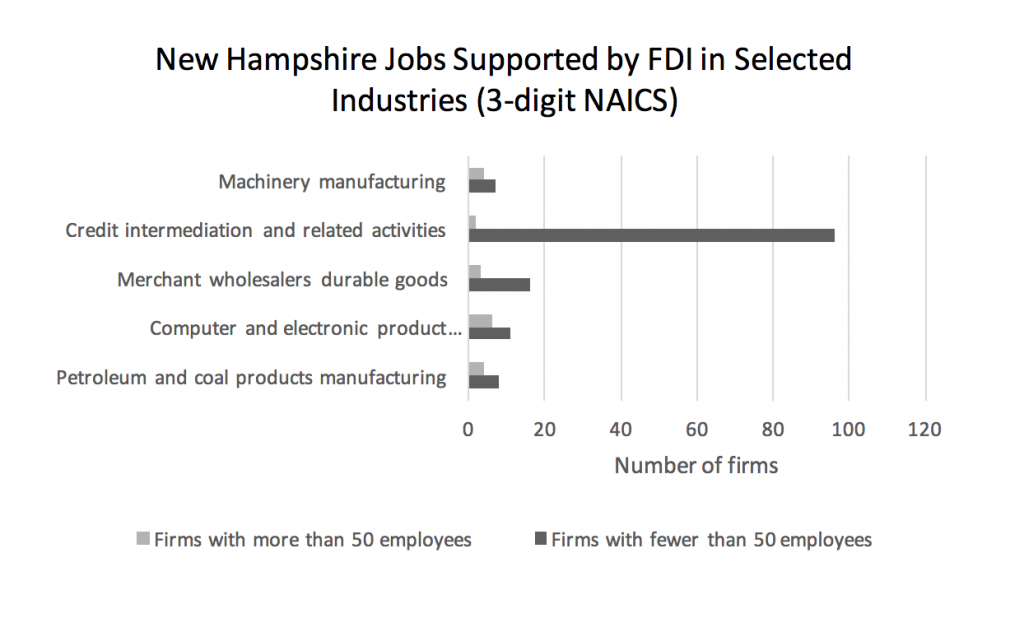
The fact that most foreign subsidiaries are very small across New Hampshire industries is evidenced by the noteworthy difference between the number of foreign firms with fewer than 50 employees and the number of foreign firms with more than 50 employees. In comparing selected industries, this difference is larger in credit intermediation and merchant wholesalers of durable goods when compared to the difference in the context of manufacturers of machinery, computer and electronic products, and petroleum and coal.
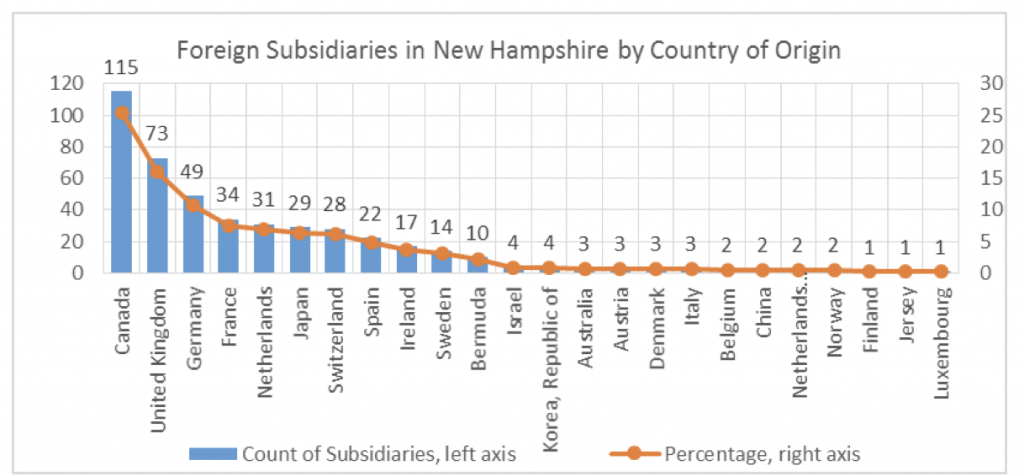
The present study provides a nuanced scrutiny of the countries of origin for foreign subsidiaries across counties and industries of New Hampshire. Understanding the sources of FDI is informative to policy makers and Economic Development Agencies (EDA) who are interested in attracting and promoting FDI. According to our sample, the Granite State attracts FDI from a total of 24 countries in Europe, North America, East Asia, Middle East, and Australia. As shown below, Canada, United Kingdom and Germany lead the countries of origin and capture a combined share of 52 percent of all foreign subsidiaries.
FDI in Hillsborough County are from 21countries of origin, led by Canada, United Kingdom, Germany and Japan. FDI in Rockingham County has 13 countries of origin, led by Canada and 4 European countries, namely Germany, Switzerland, France and United Kingdom.
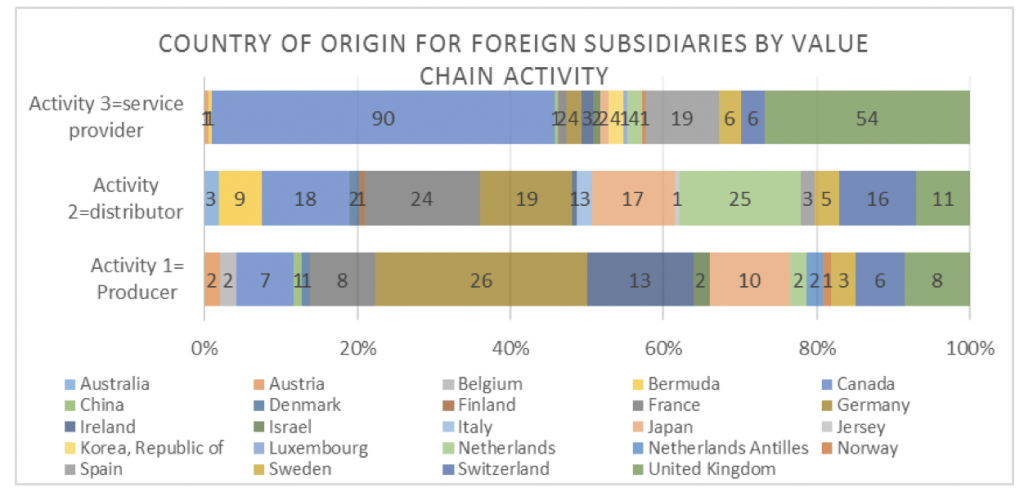
44 percent of all foreign subsidiaries in New Hampshire are service providers, followed by distributors (35 percent) and producers (21 percent). The service activity embraces FDI from 17 countries, but the top three countries of origin, namely Canada, United Kingdom and Spain, account for 81 percent of all foreign service providers in the state. Multinational manufacturers from 16 countries operate subsidiaries in New Hampshire. Germany leads other countries of origin in terms of number of foreign manufacturing firms, followed by Ireland and Japan.
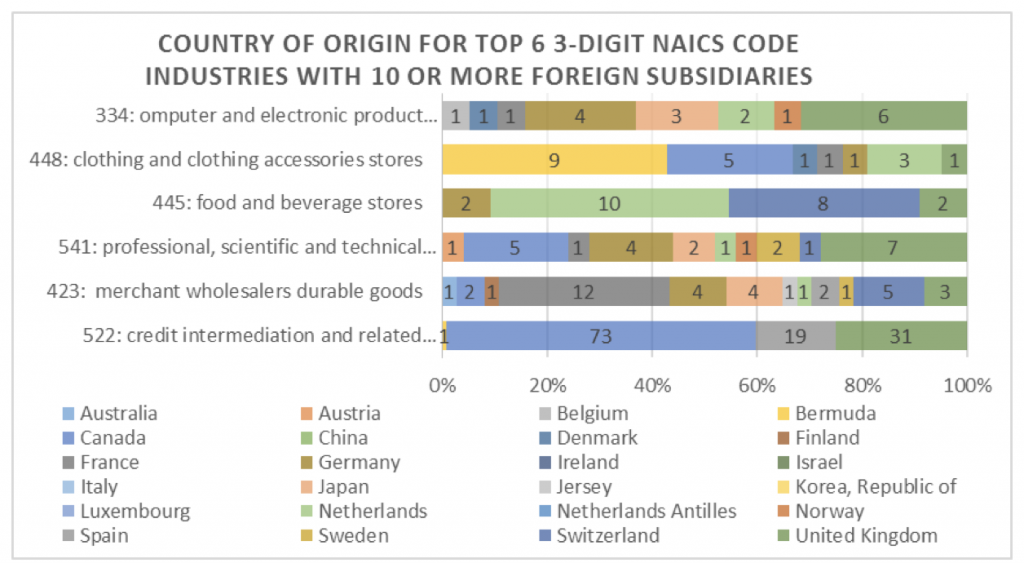
FDI made its appearance in 47 3-digit NAICS code industries across many important aspects of the New Hampshire economy including construction, manufacturing, retail, wholesale, services, lodging and food, etc. As illustrated below, 15 out of the 47 industries have 10 or more foreign subsidiaries. Credit intermediation and related activities (NAICS code 522) ranks predominately Number 1 with over a quarter of all foreign subsidiaries. Within this industry, Canada dominates, in terms of count of foreign firms, followed by United Kingdom and Spain. Merchant wholesalers durable goods (NAICS code 423) embraces FDI from 12 countries in which France leads this group with a share of near one third. The third ranked industry is professional, scientific and technical services (NAICS code 541), which attracts FDI from 10 foreign countries led by United Kingdom.
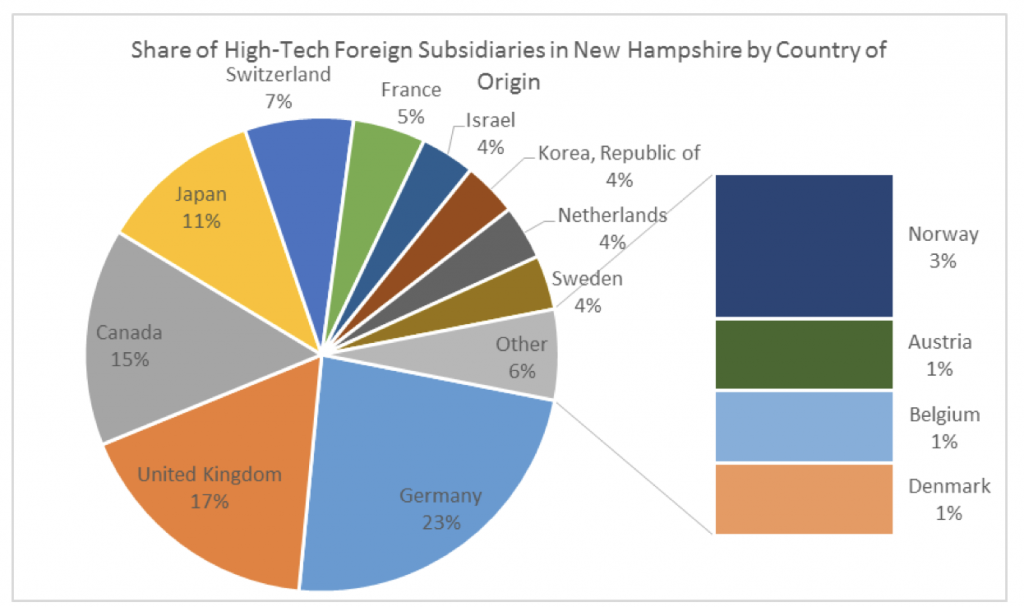
18 percent of all foreign subsidiaries in New Hampshire are in the high-tech industries. Europe is the predominant driving power for high-tech FDI, and East Asia is the other important source. Specifically, two European countries, Germany and United Kingdom, contribute 40 percent of high-tech foreign subsidiaries in combination. Two Asian countries, Japan and Korea, account for 15 percent combined.
The authors integrate the NAICS industries where foreign firms operate into 20 sectors based on the markets of product and service. About two thirds of these sectors embraces 10 or more foreign subsidiaries. Banking and financial services ranks Number 1 in terms of number of foreign subsidiaries, and is concentrated among Canadian, British and Spanish financial institutions. Although sector of computer, electronic, electrical, and communication equipment and instruments ranks the second, it is the most international with FDI from 13 countries across Pacific-Asia, Europe and North America. Germany, France and United Kingdom lead other countries of origin in this sector. The sector of textiles, clothing, footware and accessories, and the sector of professional services both rank in the third place. In the former, Bermuda and Canada lead the all 12 countries, while United Kingdom and Canada lead the all 10 countries of origin in the latter.

The authors constructed FDI Origin Index to measure and compare the level of desire for parent companies in different origins to invest in New Hampshire.[xi] This index provides useful information for the state policy-makers and EDA in regards to strategically allocating their resources in attracting FDI from various countries of origin. Mapping the countries of origin reveals a dominating desire to invest in New Hampshire from European countries, with other origins (by investment desire) scattering in North America, East Asia, Middle East and Australia. The following table shows Top 10 countries of origin ranked by FDI Origin Index.
| Country of Origin | FDI Origin Index |
|---|---|
| Germany | 674.9 |
| Canada | 276.4 |
| Switzerland | 256.4 |
| France | 231.5 |
| Italy | 200 |
| Netherlands | 173.7 |
| Sweden | 169.4 |
| Norway | 133.3 |
| Japan | 121.8 |
| Ireland | 114.1 |
FDI adds to the employment of local economies in New Hampshire. The present study creates FDI Employment Impact Index to indicate the estimated employment in New Hampshire that could potentially be supported by parent companies headquartered in a country of origin. The following figure ranks countries of origin by FDI Employment Impact Index for the 10 leading countries. The ranking highlights the importance of European countries, among which Germany, France and United Kingdom are all ranked in Top 5. Other top FDI employment driving sources include Canada and Japan. [xii]
FDI Employment Index for Top 10 Countries of Origin

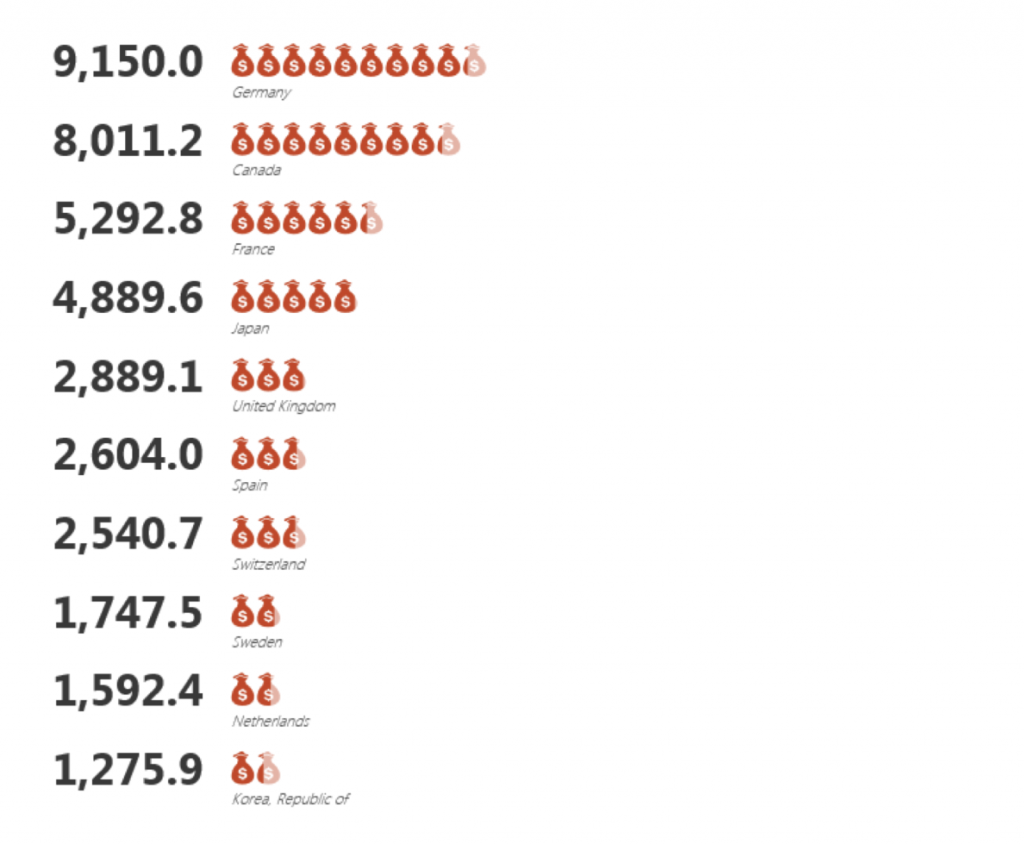
The inward FDI also contributes to the Gross State Products (GSP) of New Hampshire, realized through revenues of foreign subsidiaries. The GSP Impact Index is computed to indicate the estimated GSP that could be potentially realized by foreign subsidiaries headquartered in a foreign country. The ensuing figure illustrates the estimated GSP impact (in $million) on the New Hampshire economy of FDI for the Top 10 countries of origin. Germany and Canada are ranked Top 2 and significantly outperform France, Japan and United Kingdom who are also among Top 5 in the list.
FDI GSP Impact Index for Top 10 Countries of Origin
Endnotes
[i] For readability, this report used the terms “foreign subsidiaries” and “foreign firms” interchangeably. “Firms” are used to signify the same, as understood in the context of the study.
[ii] Investment Analysis SelectUSA, “High-Tech Industries The Role of FDI in Driving Innovation and Growth 2017”. https://www.selectusa.gov/servlet/servlet.FileDownload?file=015t0000000U1eE.
[iii] Industries for this analysis were based on SelectUSA’s identification of high-tech industries at the 3-digit level of The North American Industry Classification System (NAICS) codes.
[iv] Industries at the 3-digits level of The North American Industry Classification System (NAICS) codes.
[v] The chart included here is designed to be a visual aid only – more specific analysis is presented in the chapter addressing industries.
[vi] Industries at the 2-digits level of The North American Industry Classification System (NAICS) codes, combined.
[vii] By number of firms as employers, not by number of jobs.
[viii] Explanations are included in the Employment chapter.
[ix] The graphics included in this section are designed to give visual comparisons and representations only and no actual number of the companies was included since data in this sample is reduced as compared to our initial sample (employment data were found for 61% of the firms in the initial sample).
[x] Idem iv.
[xi] More specific analysis is presented in the chapter addressing FDI indices.
[xii] Please notice that the FDI Employment Impact index indicates the potential to support jobs; it is not the number of employment actually supported by foreign subsidiaries. So, the authors suggest to use this index in conjunction with the data on the realized employment from other sources.